


Q: Could you please show how to get the inital estimates of each parameters?
A: I think this was covered through the software demo. We have been using the Initial Estimates Tab. Here you can adjust the initial values for each of the fixed effects, like E0, a,b and g for the Gompertz model. You can either move the sliders to the right or left to select which portion or type values into the fields beside the sliders. Once you are satisfied with the fit, you need to transfer the values from the Initial Estimates tab to the textual PML code.
Q: Can the transit compartments be added in Gompertz model?
A: You can always combine elements of one model with another one. If you want to combine the distributed delay of the Simeoni model with the tumor growth function of the Gompertz model and using a proportional factor for the drug induced decay the code would look like this:
test(){
## PK Model ##
deriv(Aa = - Ka * Aa)
deriv(A1 = Ka * Aa - Ke * A1)
C = A1 / V
dosepoint(Aa, tlag=Tlag, idosevar = AaDose)
## PD Model
psi = 20 # switch
E = E1 + E2 + E3 + E4 # tumor volume is sum of tumor volumes from all compartments
deriv( E1 = E * (a - b * ln(E/E0)) - g * C * E) # Gompertz function with drug induced decay
deriv(E2 = g * C * E1 - k1 * E2) # de for first transit compartment of damaged cells
deriv(E3 = k1 * (E2 - E3)) # de for second transit compartment
deriv(E4 = k1 * (E3 - E4)) # de for third transit compartment
sequence{E1= E0} # initialize tumor
error(EEps = 1) # residual error initially set to 1
observe(EObs = E + EEps) # additive residual error model for effect
## fixed effects for PK model - all frozen ##
fixef(Ka(freeze) = c(, 4.0488, ))
fixef(V(freeze) = c(, 2.561, ))
fixef(Ke(freeze) = c(, 0.1439, ))
fixef(Tlag(freeze) = c(, 0.8454, ))
## fixed effects for the Tumor Growth Inhibition Model ##
fixef(E0 = c(, 350,)) # Initial Tumor Volume
fixef(a = c(, 0.009,)) # growth rate constant
fixef(b = c(, 0.006,)) # deceleration rate constant
fixef(g = c(, 0.05,)) # drug decay rate constant
fixef(k1 = c(,0.08,)) # transit rate constant
}
However, the question is: does this make sense?

As you can see, the fit is not great and the diagnostics show that this model is inferior to all models that were presented.
Q: In the Simeoni model - what is E versus E1, etc?
A: E stands for the total tumor volume whereas E1 is the tumor volume of proliferating cells and E2, E3 and E4 stand for tumor volume of cells in various dying stages. The total tumor volume is the sum of all tumor volumes in E1 to E4.
Q: Can we keep a single rate constant instead of the kill rate and transit rate (k1 and k2) separately?
A: Kill rate and transit rate are two independent parameters, so you cannot use a single rate constant instead. The kill rate or better drug-induced decay rate, k2, describes how many of the proliferating cells are being damaged by the drug. The damage is proportional to the amount of drug in the body as well as to the amount of proliferating tumor cells. In this way, k2 is an index of drug efficacy. The transit rate, k1, describes the kinetics of the cell death. This process is delayed with respect to the drug treatment. The average time to death is inversely proportional to k1 (see also Simeoni, Monica, et al. Cancer research 64.3 (2004): 1094-1101).
Q: How many transit compartments to be used and how to decide on that?
A: Transit compartments is a empirical means to account for delays in the PD process. The number of transit compartments determines the shape of distribution and is more bell-shaped as the number of compartments grows. Simeoni has a nice figure about the effect of number of compartments in her publication (see reference above).
The "right" number of transit compartments is the number that provides the best fit to the data. One can always use AIC to compare the number of transit compartments (here very easy using Model Compare). If you include too many transit compartments the AIC will worsen.
Q: How to decide if we should use Simeoni or Jumbe model?
A: If you are testing several models for a given data set you should define upfront criteria for success. Typically, you choose a diagnostic like Aikaike or Bayesion Information Criterion (AIC, BIC). The model with the lower value would then be chosen. But you should also take into account inspection of diagnostic plots such as DV vs IPRED as well as CWRES vs Pred and CWRES vs IVAR.
Q: What to do if our two higher dose groups show similar tumor growth regression?
A: The Gompertz and Simeoni model, both assume the drug induced decay rate as a proportional factor. This might not be the case. As we have seen, the Jumbe model characterizes a saturable kill process. If the higher dose groups show similar tumor growth regression, you should prefer the Jumbe model over Gompertz or Simeoni.
Q: In one of your models you had a fixed exponent of 20. How is that value chosen? Will it typically be 20, or does it need to change with different tumor types?
A: The exponent psi is used in the Simeoni model. As explained in the presentation, Simeoni assumes two different phases of growth. Initially there is a phase of exponential growth followed by a phase of linear growth. These two growth phases can be described by a first-order and zero-order rate constant for the exponential and linear growth phase resp. Simeoni introduced a mathematical construct to generate a single differential equation in which she describes both growth phases together. The actual value of the exponent, psi, determines how sharp the switch between the growth phases works. In Simeoni’s experience the value of 20 seemed to be a good choice.
Q: What are the differences between E2, E3 and E4?
A: In a physiological sense, upon drug action the tumor cells are assumed to pass through 3 different stages of cell death characterized by progressive damage. However, mathematically, transit compartments are just a construct of characterizing a distributed delay.
Please note: You can easily visualize the differences between E1, E2 and E3 in Phoenix:
1. Got to Run Options and click Add Table:
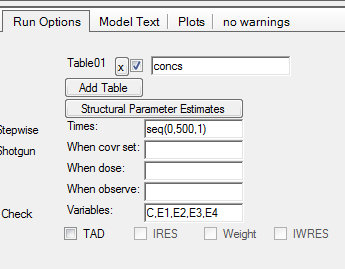
2. For Times enter a sequence statement for values between 0-500h with time interval of 1:
a. seq(0,500,1)
3. For Variables enter
a. C,E1,E2,E3,E4
4. After completion of the run you have a new table: Table01 under your results. You need to send this table to an XY-Plot object to visualize E2,E3,E4 over time:

Q: Can a single PK/tumour growth model be applied to multiple compounds by changing the PK parameters and the KC50 (relating to a Biological potency assay)?
A: You can apply the same PKPD model for tumor growth inhibition to multiple compounds. This is a typical scenario in drug discovery where you try to rank order your pre-clinical candidates using the compound’s potency, e.g. KC50.


