Q: Why an initial value of 10,000?
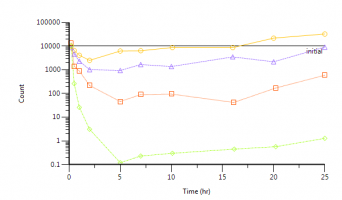
A: The rats were initially dosed with 10,000 units of resistant bacterial strain. Also, when you look at the exploratory plot, all curves start around a value of 10,000:
Q: How to initiate a sequence not at t=0?
A: As mentioned in the presentation, the sequence starts at time=0. If you want to initiate at a later time, you can use the sleep() statement. This will tell the program to wait for a specific time before executing the next line of code. If you want to initialize after 10 hours, assuming the time unit is in hours, and then another time after 24 hours, here is the corresponding PML code:
sequence {
sleep(10)
N=10000
Sleep(14)
N=5000
}
Q: Is it necessary to use log for calculating slopes for PD?
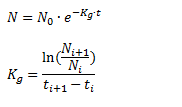
A: This has been shown in the slides. Both rate constants, Kg for growth rate and Kk for the kill rate, describe first order processes, in that the rate varies in direct proportion with the bacterial count raised to the power of one. To get initial estimates we are simplifying the indirect response model: for the downswing arm we assume bacterial growth can be neglected relative to the kill rate:
On integration this yields:
Similarly for the growth rate we are looking at the upswing arm where we assume no drug action and only bacterial growth:
On integration this yields:
Q: How would we determine the naturally-occuring-death rate (no drug effect) in Phoenix/WinNonlin based on the growth control data?
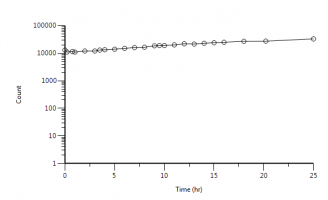
A: You can separate the control data from the data set using a Data Wizard object and a Filter step (Include where [Dose_grp]=0). Here is the plot of the control data:
You could in principle fit a simple turnover model to this data in Phoenix with differential equation:
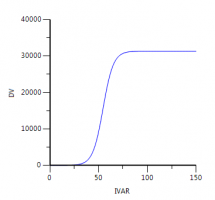
But you won’t get very good estimates since we are missing important parts of the curve, the initial phase and the plateau phase. Here is how an ideal curve for control data looks like:
We can estimate the natural bacterial death rate (Kout) from steady state using equation:
Rearranging to:
Using the final estimates from our baseline model we get:
A very small value.


