Jump to content


Photo

PK Analysis in WinNonlin with limited samples


  • Please log in to reply
5 replies to this topic

#1 lkibathi

lkibathi

    Newbie

  • Members
  • Pip
  • 3 posts

Posted 04 June 2018 - 09:13 PM

Hi all,

I would like to request your insight on analyzing a new data set for drug A that will be used for prophylaxis. I am also new to this forum and I’m not sure if this would be the correct place to ask my question. I am a trainee at NIH and I’ve been learning to use WinNonlin for about 1 year now, and would really appreciate your feedback on the following -


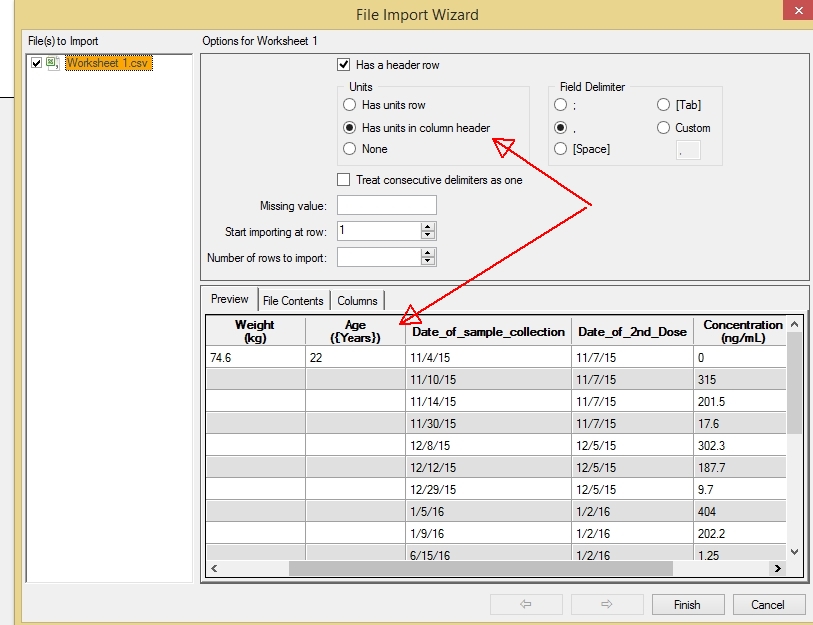
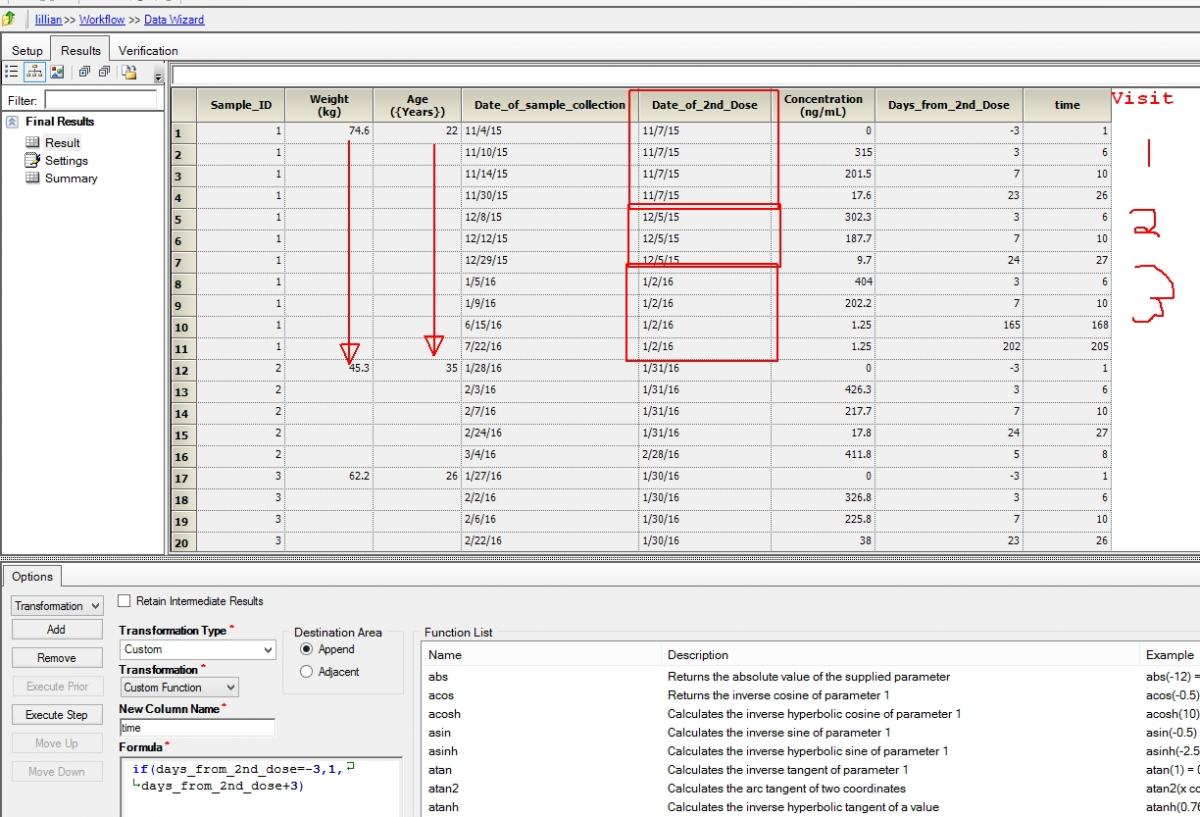
Drug A was administered in healthy volunteers monthly for 3 months on Days 1 and 2 each month, as a single dose. The study group only collected PK samples for day 2 of each dosing interval. How would I input this in WinNonlin to best characterize the PK of drug A?


Thanks

Lilian


#2 fmanera

fmanera

    Newbie

  • Members
  • Pip
  • 4 posts

Posted 05 June 2018 - 07:05 AM

Hi lkibathi,

first of all the drug dosing is iv or po? This is important to choose the appropriate model type for the NCA.


Design the worksheet is the follows:


IDsubject

Dose (mg)

Dosing (time or date)

Conc Drug (mg/mL or ug/mL)


I hope this is usefull for you


#3 Simon Davis

Simon Davis

    Advanced Member

  • Administrators
  • 1,318 posts

Posted 05 June 2018 - 10:58 AM

Lillian, are you intending to report NCA metrics and/or perform compartmental modelling, I think the latter is more appropriate from your study description?


Have you looked in C:\Program Files (x86)\Certara\Phoenix\application\Examples\WinNonlin\Supporting files eg clayton.csv


I would suggest a little more detail, this information can be in one or two worksheets;


Observations containing;

IDsubject

Visit (you said there were 3 monthly sessions of 2days each)

Actual Time Relative to Dose

Nominal Time Relative to Dose

Conc Drug (units can be 'anything' but I would recommend being consistent/cognizant of dose units too)

Treatment label

any other demographic information


Doing you

IDsubject

Visit (you said there were 3 monthly sessions of 2days each)

Actual Time Relative to Dose - i would sat first dose i.e. 0 in each visit

Dose amount


 Was it the same dose/formulation for each visit?


  It's hard to visualise; a plot or worksheet would be much easier to review/comment on.


 Simon.


#4 lkibathi

lkibathi

    Newbie

  • Members
  • Pip
  • 3 posts

Posted 05 June 2018 - 05:06 PM

H Simon,

Here is the worksheet. 

The dose is 100 mg PO on day 1 and 2 every month for 3 monthsAttached File  Worksheet 1.csv   1.48KB   410 downloads


Thanks


#5 Simon Davis

Simon Davis

    Advanced Member

  • Administrators
  • 1,318 posts

Posted 05 June 2018 - 07:24 PM

Lillian, I think your worksheet is too unclear/incomplete to work from.


First off I imported your data, note the option to read units in the column header cell; Lillian.jpg the demographics should probably be kept on every line for ease but the NLME tool can handle this as carry forward covariate if you prefer.


you should have IMO, clear clock times for when your doses were, taken, just dates or days is not going to be very precise for estimation of anything.


You should use this to calculate a total elapsed time from FIRST dose and/or first dose within each month. your data look to be pretty sparse so I would propose modelling over NCA.


I have mocked this up for your first profile, assuming the doses and the samples were obtained at the same time each day e.g. 9am. please check this and update as necessary so you can see all the dose events explicitly in your work sheet,


Note I standardised to dose of ug and conc as ug/L to minimise confusion about units. 


You could use days and fractional days if it occurs some hours apart within a day if you prefer with the long time frame of this study once you have got your records clarified; I'm just used to dealing in hours for Clearance normally.


 Simon.

Attached Thumbnails

  • lillian.jpg
  • lillian2.jpg
  • lillian_ID1.jpg
  • init_est_tab.jpg

Attached Files


Edited by Simon Davis, 05 June 2018 - 08:21 PM.


#6 lkibathi

lkibathi

    Newbie

  • Members
  • Pip
  • 3 posts

Posted 05 June 2018 - 08:17 PM

Thanks Simon. Unfortunately the study was not originally designed as a PK study and thus the sparse data. I will find out if we have data on exact time of dosing and attempt to do modeling over NCA. 

Question: how did you get the values for the "time" column, and what does it represent? 


Thanks.


0 user(s) are reading this topic

0 members, 0 guests, 0 anonymous users