Jump to content


Photo

Hide some Eta scatter graph?


  • Please log in to reply
1 reply to this topic

#1 joybaker

joybaker

    Advanced Member

  • Val_Members
  • PipPipPip
  • 45 posts

Posted 07 May 2021 - 04:24 AM

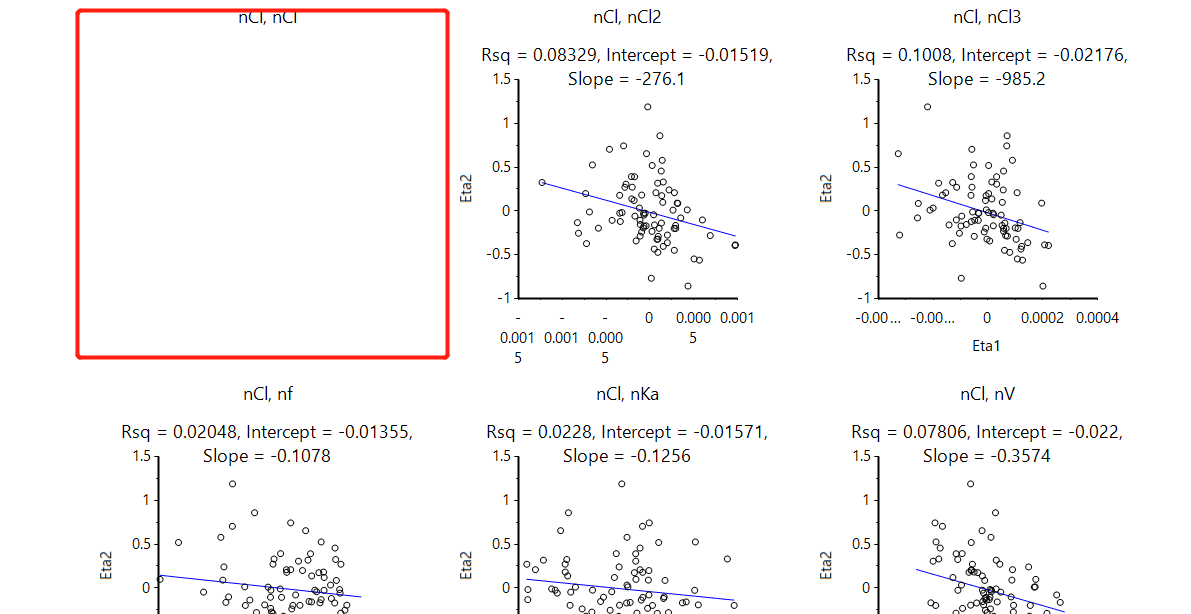
I wonder how I can hide the blank correlation plot of eta scatter plot?


For example hide the nCl-nCl plot and retain the rest in the final report.

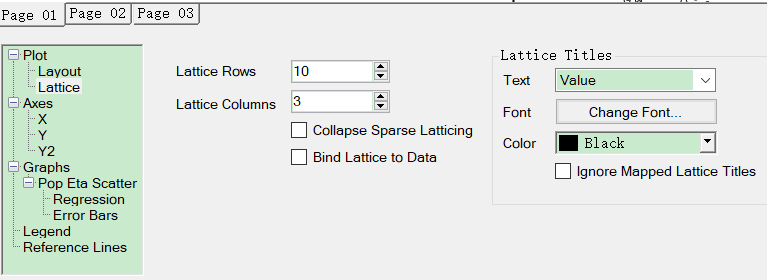
Have tried some options in Lattice but it didn't work.


Thank you


Attached Thumbnails

  • 11.png
  • 12.png

Edited by joybaker, 07 May 2021 - 04:27 AM.


#2 Ana Henry

Ana Henry

    Advanced Member

  • Val_Members
  • PipPipPip
  • 232 posts

Posted 10 May 2021 - 05:04 PM

Hello,

You can accomplish this by double clicking on the graph.  Then go to plot>lattice and select "Collapse Sparse Latticing".  In some cases you might have to first uncheck the option 'Bind Lattice to Data' and then select the number of lattice rows and columns you want to display.


Give it a try!


Ana Henry


0 user(s) are reading this topic

0 members, 0 guests, 0 anonymous users