Hi support,
I found that the R Shell would be switched to red abnormally.
for example:
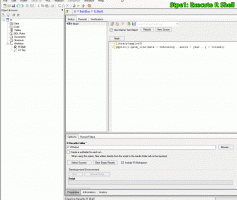
Stpe1: Execute R Shell
Stpe2: Select another object(XY Plot)
Stpe3: R Shell status turns Red!
I think the step3 is wrong, the R Shell shouldn't be red.
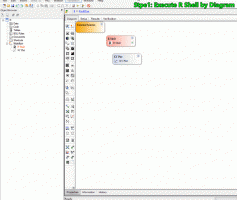
And, I've also tried executing the R Shell through the workflow diagram.
Stpe1: Execute R Shell
Stpe2: Select another object(XY Plot)
Stpe3: Select R Shell
Stpe4: Select another object(XY Plot)
Stpe5: R Shell status turns Red!
Steps 1~4 are all normal, but step 5 turns the R Shell red.
Could you help find out the cause of the issue? Or confirm whether this is a bug.
Other useful information:
R Shell Code:
library(ggplot2)
ggplot()+geom_line(data = txhousing , aes(x = year , y = volume))
- Phoenix Version:8.3.3
- R Version: 4.0.1
- ggplot2 Version:3.3.5
Thanks you in advance.
0521


