Hi all,
If I have a data set where subjects receive repeated doses, but there are several dose interruptions, how do I include this in a Phoenix data set? Do I set the missing doses to 0? The guidance isn’t clear on this.

Missed doses
Started by
gew8
, Oct 07 2022 04:17 PM
13 replies to this topic
#5

gew8
-
- Members
-

- 9 posts
Newbie
Posted 10 October 2022 - 08:11 PM
absolutely - the NLME engine is very flexible in it's input format.
Thanks. One more follow up: if you have repeated doses but no concentration data after, say, X doses are given, do you need to include the dose amounts in the data set if there's no concentration data after those doses? In other words, we know subjects were dosed, say, 20 times, but after the 10th dose, there are no concentration samples after any dose. Do dose amounts for dose 10, ..., 20 need to be in the data set?
Edited by gew8, 10 October 2022 - 10:42 PM.
#6
Simon Davis
-
- Administrators
-

- 1,318 posts
Advanced Member
Posted 11 October 2022 - 06:10 AM
personally I would enter all the dose info you have in case you want to see the full predicted conc profile throughout the experiment (you might end up extending the model to look at PD or AE
However for fitting the actual model it probably is not necessary.
#9
gew8
-
- Members
-
- 9 posts
Newbie
Posted 23 October 2022 - 08:41 PM
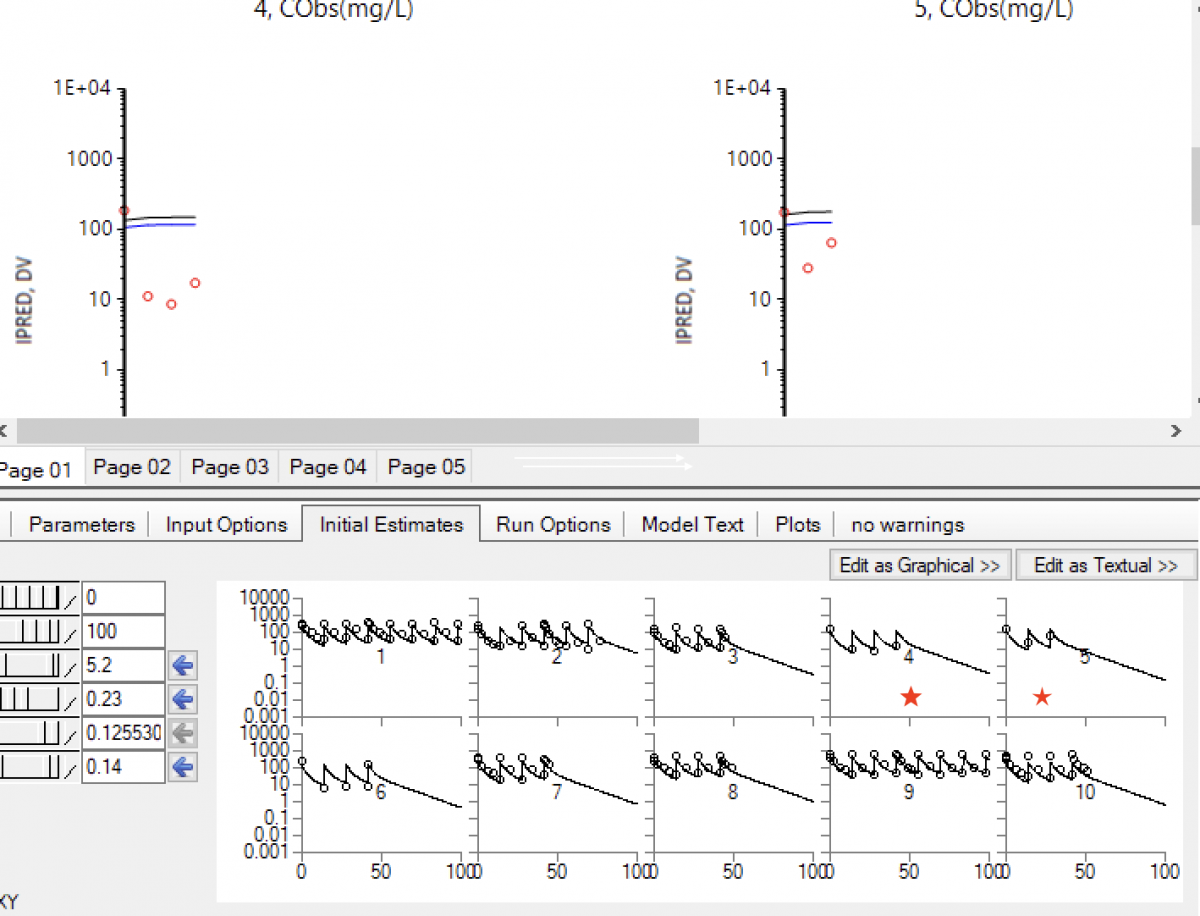
I am really having a hard time getting this model to fit. Can anyone take a look? I've tried log transforming and removing random effects but my results are weird. See model 1 specifically. The predictions look good (at least for some subjects) but the eta shinkage is enormous. When I remove etas on all but V, the fit goes awry. In model 1a, the fit looks good, but the DV vs IPRED looks bad, like the dosing isn't aligned with the fit.
Also,
1) if I use log-additive error, how can I get diagnostic plots back on original scale?
2) Is there a way to remove all random effects without doing naive-pooled? When I do this, I get an error saying the run won't work and to use naive pooled.
3) When I look at the initial estimates tab, the profiles are showing me what? Those fits look good, but I am not able to converge to estimates this accurate. In other words, the final estimates, as reflected in the PRED, DV, IPRED vs. IVAR (time) plots for many of the subjects, are nowhere near as good as suggested by the initial estimates. See subjects 4 and 5 in the attached plot...the starred plots at the bottom correspond to the plots above. What am I missing?
Attached Thumbnails
Attached Files
-
 Project3.phxproj 7.61MB
83 downloads
Project3.phxproj 7.61MB
83 downloads
Edited by gew8, 24 October 2022 - 04:59 AM.
#10
Simon Davis
-
- Administrators
-
- 1,318 posts
Advanced Member
Posted 25 October 2022 - 05:06 PM
1) if I use log-additive error, how can I get diagnostic plots back on original scale?
they could be misleading - you can create a table with the desired points and plot almost everything from there.
2) Is there a way to remove all random effects without doing naive-pooled? When I do this, I get an error saying the run won't work and to use naive pooled.
it is impossible, random effects are part of the engine. if you don't have random effects then I would expect Naive Pooled to be appropriate pop engine, what is your concern.
3) When I look at the initial estimates tab, the profiles are showing me what? Those fits look good, but I am not able to converge to estimates this accurate. In other words, the final estimates, as reflected in the PRED, DV, IPRED vs. IVAR (time) plots for many of the subjects, are nowhere near as good as suggested by the initial estimates. See subjects 4 and 5 in the attached plot...the starred plots at the bottom correspond to the plots above. What am I missing?
Initial estimates uses not only the supplied points but also simulates about 300 points to make the plot smoother. For that subjects there are Ctrough concs in the data only. They are connected directly on the plots, that's why it looks so confusing (residuals worksheet is used). You can request a table and build your own diagnostic plots with the any degree of precision.
Simon.
#12
Simon Davis
-
- Administrators
-
- 1,318 posts
Advanced Member
Posted 25 October 2022 - 07:41 PM
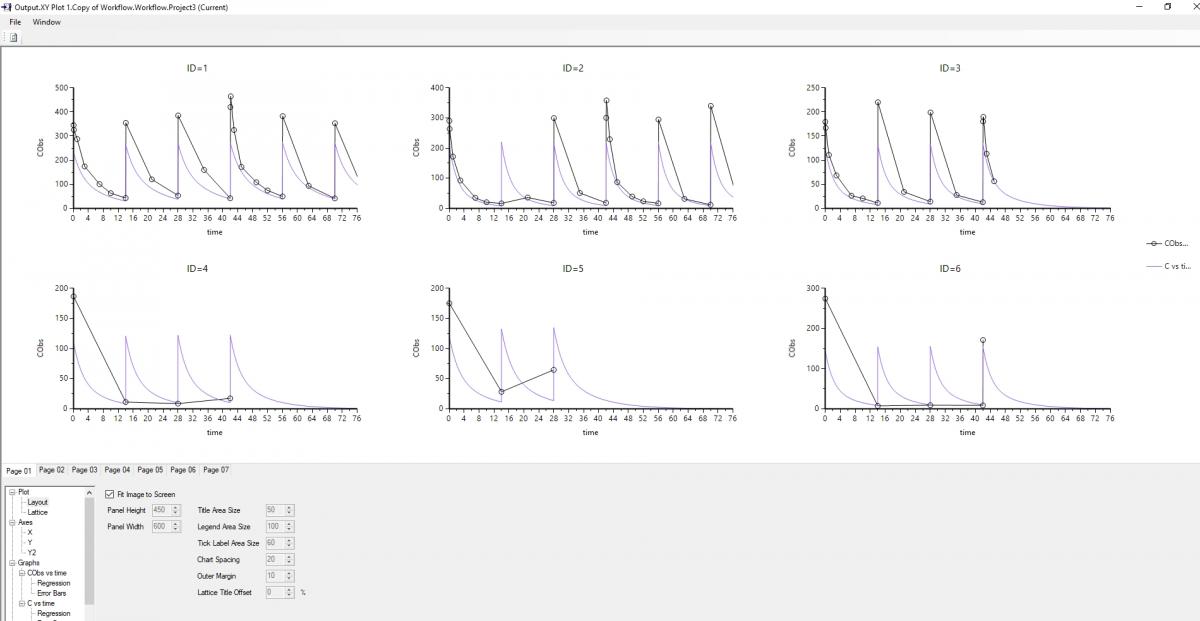
I was trying to explain that the default plots are the same as if you plotted the residuals table, if you request a table with a richer output, e.g. seq(0.25,248,.25) then you will see a smoother curve and your fit is looking quite good;
SImon.
Attached Thumbnails
Edited by Simon Davis, 25 October 2022 - 07:41 PM.
#13
gew8
-
- Members
-
- 9 posts
Newbie
Posted 03 November 2022 - 07:47 PM
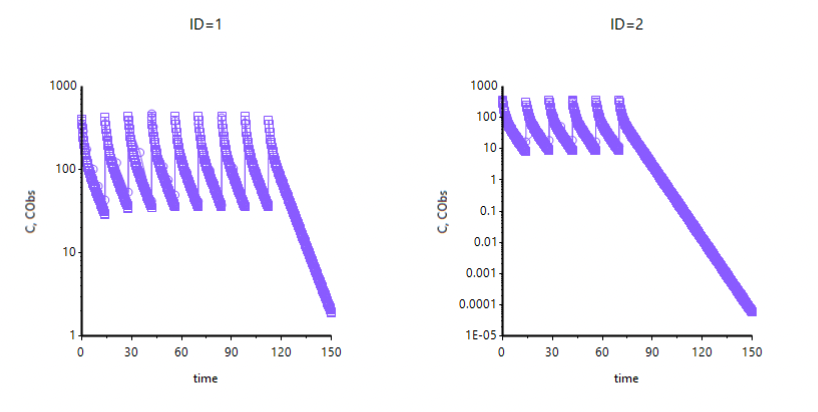
Sorry to belabor this point, but how are you requesting the richer output? Just by add table, right? I can’t seem to get a smooth plot. Is there a way to make the predicted C values smaller? They look huge. In my plots I have both CObs and C on y-axis but it doesn’t look like you do. Can't figure out how to edit this to look like your outputI was trying to explain that the default plots are the same as if you plotted the residuals table, if you request a table with a richer output, e.g. seq(0.25,248,.25) then you will see a smoother curve and your fit is looking quite good;
SImon.
Attached Thumbnails
Edited by gew8, 03 November 2022 - 11:25 PM.
#14
Simon Davis
-
- Administrators
-
- 1,318 posts
Advanced Member
Posted 04 November 2022 - 07:08 AM
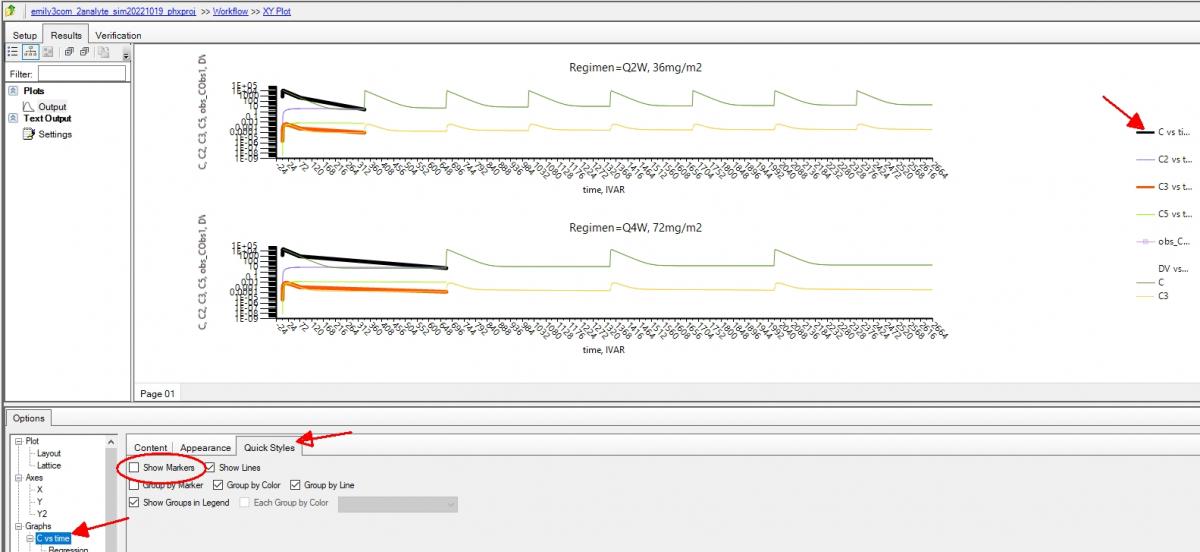
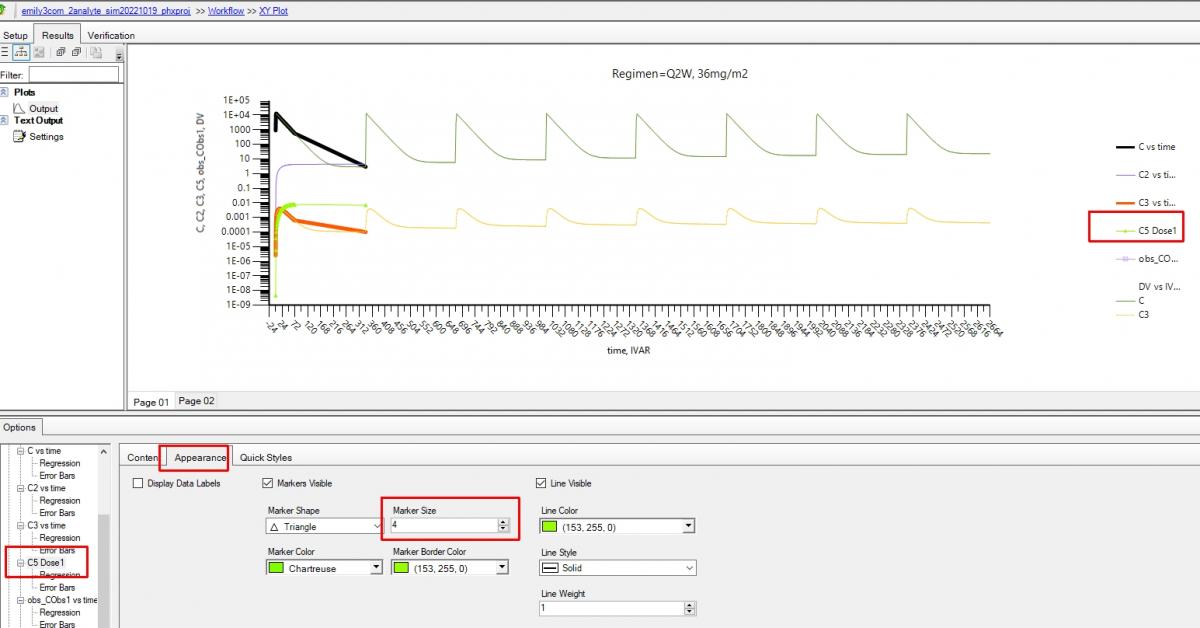
Hi, any plot can be formatted in Phoenix, (embedded ones automatically created by the models will need you to double click on the name in the Results tab), by looking at the 'tree' of the lower tab.
Select the series you want to format and if you just want to display the line only (what I normally do for simulations to make clear not real observed data points,) then use Quick styles tab and hide them in a single click.
More refined formatting to change size, colour, shape etc, is under Appearance, Note you can also change the title of the series that will appear in the legend as I did for C5 in the second screen shot below. I think if you try this out you'll find it intuitive and fast.
Simon.
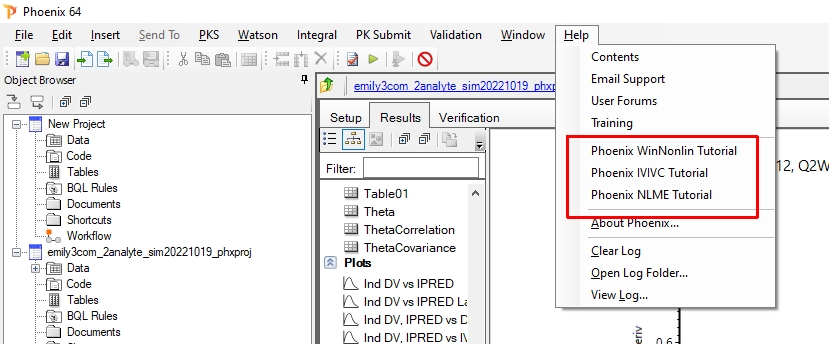
PS have you explored the tutorials included for free and linked from Help? e.g. this one on NLME shows adding a Table to a model https://youtu.be/5SSzzc94Fms?t=1008
Attached Thumbnails
Edited by Simon Davis, 07 November 2022 - 03:01 PM.


0 user(s) are reading this topic
0 members, 0 guests, 0 anonymous users

