Hi Stat06,
Your questions are fundamental to performing valid IVIVC and I would suggest you attend some training or read up some more about model fitting in general and specifically correlation of IVIVC.
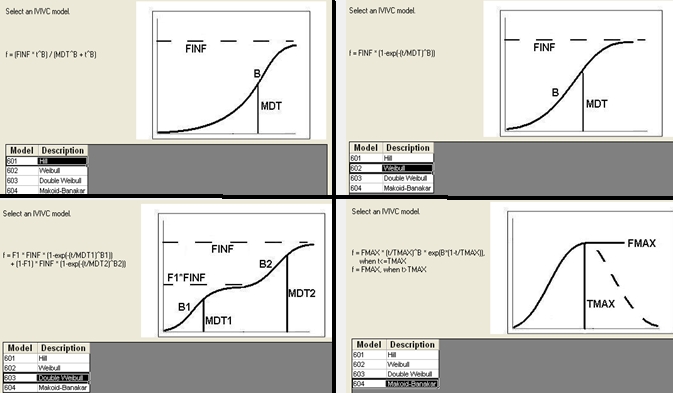
1.) How is the dissolution model selection to be made ?
> just like any other model fitting and selection process, reviewing visual diagnostics like goodness of fit as well as AIC etc to choose the model that best describes your data. For in vitro dissolution experiments there is the further complication as you may try to optimise your experiment there as best as you can to match observed in vivo behaviour.

2.) What is the logic behind increasing the number of UIR exponentials?
> this equates to the number of apparent compartments observed in your reference in vivo, if you see 1 compartment then you need only one exponential, for 2 compartments you will need the macro constants to describe those (A & B, which are the intercepts and alpha and beta, the slopes.
3.) How to choose the correlation model amongst the three options given?
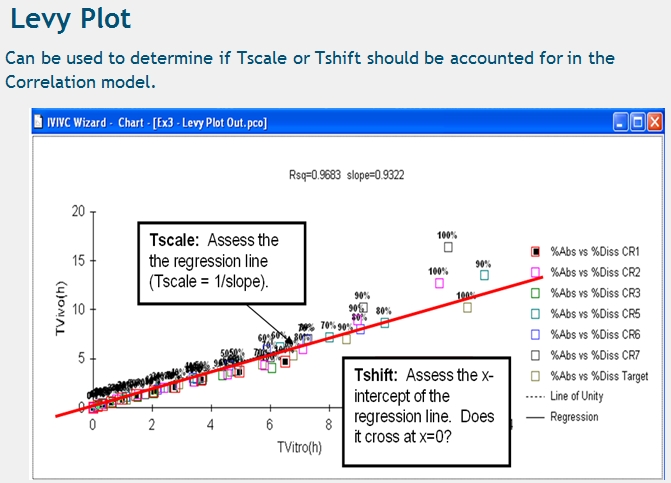
again visual inspection and goodness of fit diagnostics. the Levy plots will help you here, e.g. the line crosses at 0 then you could disregard Tshift from your model as your dissolution model is closely resembling any Tlag observed with the oral data.
/extranet/media/kunena/attachments/legacy/images/levyplot.jpg
Simon