I am working with a data set with subjects receiving different doses of an oral drug once or twice daily (and the am and pm doses could be different) over a 6 month period of time. I need to estimate AUC for drug exposure for PK/PD relationship. I see how AUC can be derived as a secondary parameter from a PPK analysis for single dose A1/Cl but have struggled with an appropriate formula given the multiple dosing strategy. I would appreciate any insight/assistance. Thanks.

Assistance calculating AUC as secondary parameter
Started by
Lisa Davis
, Nov 20 2012 09:13 PM
11 replies to this topic
#2

serge guzy
-
- Members
-

- 485 posts
Advanced Member
Posted 20 November 2012 - 09:19 PM
Dear Davis
The easiest way to compute AUC from t=t0 to t=t1 is first to do a populaiton fit with "add tables" otpion where you request many time points. This will give you the predicted response at each of these time points. The table is tored as table01. then as a second step, you just do a non compartmental analysis opn these profiels that have been generated. This will give an accurate AUC for each patient or for the population.
Let me know if you need furhter help and I can create a project that woudl compute AUC the way you want but I need the model youa re uinsg and the dosing schema.
Best
Serge
#3
Lisa Davis
-
- Members
-
- 6 posts
Newbie
Posted 01 January 2013 - 10:25 PM
Serge,
Thanks for your help on the tables. I am still a little unsure as to whether I am calculating AUC values accurately. The PPK model is 2 compartment extravascular with lag time. I have multiple dosing scheme, with different am/pm doses so file setup for NCA seems a bit complicated. I am thinking the best way would be to calculate the AUC over TAU of 24 hours (although some patients took drug Q12H and others Q24) after a time when most concentrations are steady-state. One of the parameters is AUC_TAU, and I think this is it, but I don't see this term in any of the definitions/glossaries in any of the supporting documents or help guide. What do you think?
Thanks, Lisa
#4
serge guzy
-
- Members
-
- 485 posts
Advanced Member
Posted 02 January 2013 - 02:32 AM
Dear lisa
When you do non compartmental analysis, you will see when you select the dosing tab and internal worksheet the columns Dose, time of Dose and the optional column Tau. Tau is the dosage interval for steady state . However you need to filter your data as for
steady-state data, the computation assumes equal dosing intervals (Tau) for
each profile, and that the data are from a “final” dose given at steady-state.Therefore you need to remove all the non steady state observations. You can always select AUC partial area tab and select start time and end time. This way, you are sure that AUC will be computed correctly. If your data do not start at t=0, then most likely that Phoenix will give you Auc FROM 0 TO THE END OF THE DOSAGE INTERVAL and sometimes this is not what you want because you start your interval at t not equal 0. Best is you to send me the project if you still have problems. I will be happy to give you the right push if I can.
Best Regards and happy new year;
Serge
#5
serge guzy
-
- Members
-
- 485 posts
Advanced Member
Posted 02 January 2013 - 02:34 AM
Page 300 of the user manual.
Time deviations in steady-state data
When using steady-state data, Phoenix computes AUC from dose time to dose
time + tau, based on the tau value set in the Dosing panel. However, in most
studies, there are sampling time deviations. For example, if dose time = 0 and tau
= 24, the last sample might be at 23.975 or 24.083 hours. In this instance, the
program will estimate the AUC based on the estimated concentration at 24
hours, and not the concentration at the actual observation time. For steady state
data, Cmax, Tmax, Cmin and Tmin are found using observations taken at or after
the dose time, but no later than dose time+tau.
Best
Serge
#6
Lisa Davis
-
- Members
-
- 6 posts
Newbie
Posted 02 January 2013 - 03:10 AM
Thanks Serge and Happy New Year to you as well.
I had read through again the NCA calculations section, as well as the time deviations so I did recognize that I had to ensure with multiple dosing to calculate AUC over the Tau at steady-state. Since some of the dosing intervals are different among patients, I normalized them all for 24 hours. I ran the analysis for a partial area for 24 hours starting at 480 hours since that seemed to be about steady-state for patients and much later we didn't have samples for some patients. I was thinking that other values such as Cmax and threshold values (we are also looking for drug effect) would be valid since the calculations would be for the partial area time period, correct? Anyway, if you can take a peek at the data file setup and NCA that would be helpful to see if what I've done makes sense for the accurate values. The project is about 43MB so it won't upload. If you are able to take a look, I can trim off some of the runs and send it on. Thanks again, Lisa
#7
serge guzy
-
- Members
-
- 485 posts
Advanced Member
Posted 02 January 2013 - 03:14 AM
Dear Lisa
Yes please send me just a few patients and what you did. If problems with the forum upload, you can send me at poppharm@gmail.com . I will then tale a look at it tomorrow and hopefully I can help you. If you can send it first through the forum, it would be bettter as my colleagues can also take a look if possible.
best Regards;
Serge
#8
Lisa Davis
-
- Members
-
- 6 posts
Newbie
Posted 02 January 2013 - 03:57 AM
Dear Serge,
This file should work. The dataset is included with the final model. I then simulated concentrations for the patients and NCA analysis. You can see the partial areas and dosing information that I used. Since my simulations were not synced with the times, I am not sure that the Tau and calculations are set up correctly. Any advice would be greatly appreciated. Thanks much, Lisa [file name=Project_1.phxproj size=5419737]http://pharsight.com/extranet/media/kunena/attachments/legacy/files/Project_1.phxproj[/file]
This file should work. The dataset is included with the final model. I then simulated concentrations for the patients and NCA analysis. You can see the partial areas and dosing information that I used. Since my simulations were not synced with the times, I am not sure that the Tau and calculations are set up correctly. Any advice would be greatly appreciated. Thanks much, Lisa [file name=Project_1.phxproj size=5419737]http://pharsight.com/extranet/media/kunena/attachments/legacy/files/Project_1.phxproj[/file]
Attached Files
-
 Project_1.phxproj 5.17MB
478 downloads
Project_1.phxproj 5.17MB
478 downloads
Edited by Simon Davis, 08 May 2018 - 10:46 AM.
#9
serge guzy
-
- Members
-
- 485 posts
Advanced Member
Posted 02 January 2013 - 05:42 AM
Dear Lisa
I got your file but there is no data mapped to the NCA for some reason. I guess it is table02(can you confirm). Now here is what I think is not right. You obvisouly simulated data that are partly in steady state and not steady state. When you use tau, Phoenix assumes all the observations are in steady state which is not the case here. I think you need to filter all the non steady state data and redo the same run. Best is to force the first time point at ss to be zero and all other relative to it. Then the time of dose will be 0 and tau 24 and you will ask for AUC0-25 (or 24) for the partial areas. May be my colleagues can add more on this issue.
it seems to be more a Phoenix Winnonlin than NLME at this point.
Let me know if this hint was useful.
best Regards;
Serge
#11
Lisa Davis
-
- Members
-
- 6 posts
Newbie
Posted 29 January 2013 - 06:53 PM
Thanks Serge,
Your suggestions were a real help. I simulated the datasets, then excluded the time points prior to steady-state, then substituted the times for values times 0-24. I ran NCA which gave me the AUC estimates for the 24 hour Tau. I tried to follow as Jason (below suggested) - because it seems as though that should have worked, but I may have input the code incorrectly. I have a couple more questions, but they're really WinNonlin issues so i'll post them there. Thanks so much again.
#12
Simon Davis
-
- Administrators
-

- 1,342 posts
Advanced Member
Posted 07 May 2013 - 07:46 PM
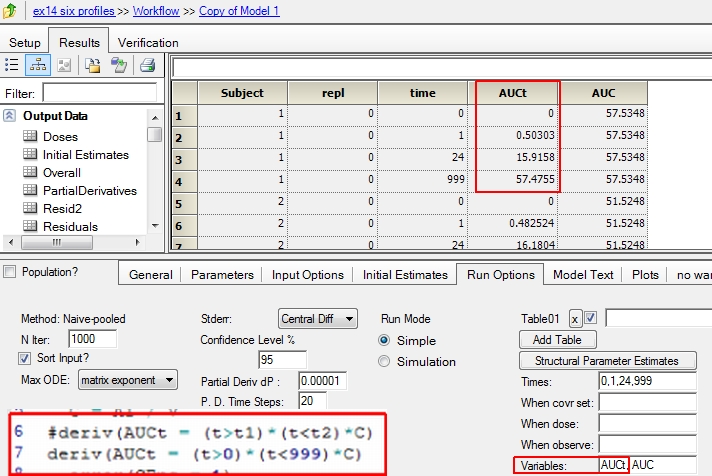
Ian, I had meant to include this screenshot before showing how to do this, sorry for the delay; If you want AUC_t1 to t2 you can add an ODE to the model and capture the value at t2 in a table statement; e.g
#deriv(AUCt1_t2 = (t>t1)*(t<t2)*C)
deriv(AUCt12 = (t>0)*(t<12)*C)
deriv(AUCt12_24 = (t>12)*(t<24)*C)
deriv(AUCt24 = (t>0)*(t<24)*C)
deriv(AUCt999= (t>0)*(t<999)*C)
deriv(AUCtinf=C)
Simon )*c)>
)*c)>
#deriv(AUCt1_t2 = (t>t1)*(t<t2)*C)
deriv(AUCt12 = (t>0)*(t<12)*C)
deriv(AUCt12_24 = (t>12)*(t<24)*C)
deriv(AUCt24 = (t>0)*(t<24)*C)
deriv(AUCt999= (t>0)*(t<999)*C)
deriv(AUCtinf=C)
Simon
)*c)>
Attached Thumbnails
Edited by Simon Davis, 10 March 2022 - 09:59 AM.
- littlepetinga likes this


0 user(s) are reading this topic
0 members, 0 guests, 0 anonymous users

