Hi,
I'm trying to build a multiple-category proportional-odds logistic model. I understand that I can do this with the "multi" statement, but I'm finding practical examples pretty thin on the ground in the documentation.
I've been through the examples (NLME 1.2 User's Guide, p40; Phoenix 1.3 Modeling Language Ref Guide, p56) and the fitting goes OK, but I'm struggling to see how to generate tables of data from these fits. It seems to me that's an obvious next-step, but I'm not sure the machinery is entirely in place to enable this. Triggering output on observations doesn't seem to work (as it does for PK/PD models).
Can anyone help me generate curves to overlay on the data for the 8 individuals in the NLME User's Guide? I'm using this model (more or less straight from the book):
test(){
covariate©
E = Alpha + Beta*C
# Can use either LL or multi for binomial problems
# multi can handle up to ten simultaneous ordinal (proportional-odds) categories,
# and has more flexibility in terms of inverse link functions
# prob=exp(E)/(1+exp(E)) # this is ilogit(E)
# LL(EObs, EObs==1 ? log(prob) : log(1-prob) )
multi(EObs, ilogit, E)
stparm(
Alpha = tvAlpha * exp(nAlpha)
Beta = tvBeta
)
fixef(
tvAlpha = c(, -1.70212, )
tvBeta = c(, 0.41354, )
)
ranef(diag(nAlpha) = c(0.27541785))
}

logistic regression modeling
Started by
Frank Gibbons
, Jan 22 2013 04:35 PM
24 replies to this topic
#2

serge guzy
-

- Members
-

- 485 posts
Advanced Member
Posted 22 January 2013 - 07:41 PM
Dear colleague
I attached the updated project that enables you to get probability plots with the corresponding observations. What I did was to add a fake time dependent model to enable tables. I made a copy of the rep column and called it time. I made a copy of the response and called it copyobservation which then was defined as a response (I guess you can do that ina simpler way). I defined the probability in the model and asked for a table. Let me know if it helps you.
best Regards;
Serge [file name=EX6_Logistic_Model_serge_add_official_version.phxproj size=1947222]http://pharsight.com/extranet/media/kunena/attachments/legacy/files/EX6_Logistic_Model_serge_add_official_version.phxproj[/file]
Attached Files
-
 EX6_Logistic_Model_serge_add_official_version.phxproj 1.86MB
496 downloads
EX6_Logistic_Model_serge_add_official_version.phxproj 1.86MB
496 downloads
#3
Frank Gibbons
-
- Members
-
- 26 posts
Member
- LocationBoston area, Massachusetts
Posted 22 January 2013 - 08:09 PM
HI Serge,
First off, thank you for responding so quickly. Given the overall level of activity in this forum, that's faster than I ever anticipated.
As it happens, ultimately I'm interested in using this to simulate multiple ordinal logistic regression for a tox model, so time will have a natural place in my model. It's still striking that you have to include a fake PK model, introducing time, in order to generate a table for a *logistic* model?! And it looks like you're fitting to an empty observation column CObs?
I see that I can eliminate "observedresponse=copyobservation" and get the same output.
Thanks, this is very helpful. I never would have come up with this without your help.
One question: I tried removing the random effects from the fake PK model, and get a FAIL, with this message in Warnings and Errors:
Error in Population:
'".\NLME7.exe"' is not recognized as an internal or external command,
operable program or batch file.
Model execution failed or cancelled
This is surprising to me, since I didn't completely remove random effects (they're still there in the logistic part). Can you explain?
Thanks again
-Frank
#4
serge guzy
-
- Members
-
- 485 posts
Advanced Member
Posted 22 January 2013 - 09:53 PM
Dear Frank
I do not see any problem removing the PK random effects. the updated project is attached.
Let me know if you can run my project and if you had an error, please send me the project and I will debug.
best Regards
Serge [file name=EX6_Logistic_Model_serge_add_official_version-20130122.phxproj size=2591216]http://pharsight.com/extranet/media/kunena/attachments/legacy/files/EX6_Logistic_Model_serge_add_official_version-20130122.phxproj[/file]
Attached Files
-
EX6_Logistic_Model_serge_add_official_version-20130122.phxproj 2.47MB
0 downloads
#5
Frank Gibbons
-
- Members
-
- 26 posts
Member
- LocationBoston area, Massachusetts
Posted 23 January 2013 - 02:18 PM
Oops, my bad. What I did was entirely remove (comment out) the stparm statement, which of course will cause NLME to issue an error. Simply commenting out the term containing eta within the stparm (as you did) is the way to do this.
Regards,
-Frank
#6
Frank Gibbons
-
- Members
-
- 26 posts
Member
- LocationBoston area, Massachusetts
Posted 28 January 2013 - 10:41 PM
Hi,
I'm going to push my luck, and see if I can get help understanding this one. I'm working off Agresti's book on modeling categorical data, specifically Table 6.7 on relating party affiliation (Dem/Rep) with political ideology (5-point scale from "Very Liberal" to "Very Conservative").
I believe that's what the attached project encodes, and I've done my best to fit it using the fake-PK model that Serge introduced earlier (to bring in a covariate), with a main effect (beta) and four cutoffs (alphas, to fit the five levels of ideology). Initial values for cutoffs for beta and the alphas are chosen very close to what's shown as the final result. The goal is to associate party with ideology.
I can't get this to fit - it runs, but won't fit. Any ideas why? (Yes, I used the data wizard to convert the textual labels into ordinal numbers.) [file name=logistic_regression.phxproj size=427401]http://pharsight.com/extranet/media/kunena/attachments/legacy/files/logistic_regression.phxproj[/file]
-Frank
Attached Files
-
logistic_regression.phxproj 417.38KB
0 downloads
#9
serge guzy
-
- Members
-
- 485 posts
Advanced Member
Posted 29 January 2013 - 01:24 AM
Dear Frank
I had the mdoel working with both population and no population. I used a different paramettrization but your model would work if you reverse the order of the intercepts in multi (see attached project). For some reason I got a better -2ll with my parametrization. Look at it and let me know if ti is clear.
best
Serge [file name=logistic_regression_official_version.phxproj size=2028593]http://pharsight.com/extranet/media/kunena/attachments/legacy/files/logistic_regression_official_version.phxproj[/file]
Attached Files
-
logistic_regression_official_version.phxproj 1.93MB
0 downloads
#10
Frank Gibbons
-
- Members
-
- 26 posts
Member
- LocationBoston area, Massachusetts
Posted 30 January 2013 - 02:37 AM
Hi Serge,
Thanks for taking the time to look at my rather incompetently-built model, and turn it around so fast. I've learned a lot from looking over what you sent, but have to admit I find myself "still confused...but at a higher level" (as the physicists like to say ;-)
Your workaround of introducing spurious PK (through cfmicro) introduces time, which allows for tabular output, but I find myself confused about exactly how to interpret that. In addition, the dosepoint() statement is superfluous, as is the Cfake statement. In fact, cfmicro() seems to be the only strictly necessary part. But I've moved away from that, as I said.
It's true that your corrected version of my model runs to completion, producing parameter estimates. Yet, they're not what I expected, and so I've stripped down to a much simpler model for the time being.
One issue that I'm still struggling with (and which you identified) is the identification/interpretation of the third and subsequent parameters in the multi() statement. The manual suggests that they are ordered expressions of the form 'C-X01', where C is presumably the independent variable, and X01 is the cutpoint between classes (and you pointed out that switching the order could allow the model to converge). The question is: how do I compute those cutpoints from an equation of the standard form: logit = beta*C + alpha_i, for i classes. I'm no longer convinced that the values I'd been using are correct.
Simon - can you point me to examples where this explained in more detail than is currently in the documentation (perhaps there are whitepapers that I've overlooked?)
Thanks,
-Frank
#11
serge guzy
-
- Members
-
- 485 posts
Advanced Member
Posted 30 January 2013 - 03:16 PM
Dear Frank
That is exactly the rwason I am using the "parallel slopes" parametrization which to me is easier and works very well. I guess you can always use the ilogit formula (exp(x)/(1+exp(x)) to get some sense of where you are
best
serge
#12
Emily Colby
-
- Members
-
- 88 posts
Advanced Member
Posted 08 February 2013 - 02:42 PM
Dear Frank, I worked with Serge to get the same results as SAS for the Agresti example you were referring to. Only the signs are different because of the way it is coded. Note that PML doesn't have anything equivalent to SAS's "Freq count", so the input data needed to be modified by repeating rows. For example, the first row of the dataset is Gender PoliticalParty PI Count D_OR_R PI_NUMBERS F Dem Very Liberal 44 1 1 Without anything like "freq count" we need to repeat this row 44 times before modeling it in PML. This was done for you in the attached project. If you look at the theta worksheet (in the Results tab), you can see the results are the same as the SAS output in the Agresti book except for the signs (negative or positive), due to the coding convention used. In the PML code attached, we used the LL() function, but Serge knows how to make the multi() function work correctly as well. Serge was able to make it so the results matched SAS perfectly, even the signs, by subtracting 1 from the responses. I think he is on vacation this week, though, and I don't want to bother him. The interpretation of the intercepts (alphas) is that they are cumulative logits. With five categories, it becomes difficult to interpret, but possible. I prefer Dr. Gary Koch's polytomous logistic regression example, in Chapter 9 of his Categorical Data Analysis book, with only three categories, when first learning about the topic. The interpretation is easier. In his example, our two cumulative logits are: Marked improvement vs some or none (corresponds with alpha1), Some or Marked improvement vs none (corresponds with alpha2). Note there are other methods for analysis of categorical data structured this way, involving SxR or sets of SxR tables, which may be easier to interpret. Best regards, Emily [file name=logistic_regression_polytomous2.phxproj size=1168713]http://pharsight.com/extranet/media/kunena/attachments/legacy/files/logistic_regression_polytomous2.phxproj[/file]
Attached Files
-
logistic_regression_polytomous2.phxproj 1.11MB
55 downloads
Edited by Simon Davis, 27 August 2024 - 03:17 PM.
#13
Frank Gibbons
-
- Members
-
- 26 posts
Member
- LocationBoston area, Massachusetts
Posted 11 February 2013 - 06:09 PM
Hi Emily, I can't thank you enough for your detailed and clear solution to the original problem I posed! I had just realised that part of the problem was my encoding of the data as aggregated (as shown in books) rather than individual instances (repeated lines), but thanks for confirming that. I think I now understand how to do it with LL(), so many, many thanks for that. When Serge gets back from vacation, I'd love to understand how to make this work with multi(). FWIW, I don't have trouble understanding the meaning of the cumulative logits - my problem lies in what EXACTLY those arguments in the multi() statement ARE. It looks like they take the form of 'IV - logit', but that doesn't run to completion for me. In the spirit of sharing, I offer your project back to the forum, but with the model annotated in the hope that others will find it and learn from it as I did. Thanks, -Frank [file name=logistic_regression_polytomous2-20130211.phxproj size=1840435]http://pharsight.com/extranet/media/kunena/attachments/legacy/files/logistic_regression_polytomous2-20130211.phxproj[/file]
Attached Files
-
logistic_regression_polytomous2-20130211.phxproj 1.76MB
48 downloads
Edited by Simon Davis, 27 August 2024 - 03:17 PM.
#14
Emily Colby
-
- Members
-
- 88 posts
Advanced Member
Posted 11 February 2013 - 06:20 PM
Frank,
I think the difference with Multi() is that it assumes the data are coded (0,1,2,3,4) instead of (1,2,3,4,5), but I would have to wait for Serge's reply to confirm. He had mentioned something to that effect, and that we have to subtract 1 from all the responses to get Multi() to work. The multi() statement in the project I had attached (which is commented out: #multi(...) so that LL() is used instead) I think will work as long as the responses start at 0 instead of 1. Note for others reading this, you can either use Multi() or LL(), but not both, as they are both supposed to perform the same thing. With LL() you have more control over the way it is coded, as you program in the responses.
Also, I don't know if it makes a difference, but I sorted the data in descending order in the responses within the dataset (5,4,3,2,1) because that is what SAS requires, or at least that was how I learned it, and I wasn't sure whether or not PHX requires it as well (I also unchecked "sort input" in the run options tab so that it would not re-sort the data prior to running the model, though I haven't tested whether the results are different with the sorting of the data either way).
Best regards,
Emily
#15
serge guzy
-
- Members
-
- 485 posts
Advanced Member
Posted 11 February 2013 - 06:51 PM
Dear Frank I just came back and here we go with the multi project. As emily pointed out, the data must start with category 0,1,2... Therefore you just substract your current data by 1. Emily made the right correction when she dupicates the current data by the "frequency". We do not have that column in multi or LL . The sign in the output depends on how you parametrize the cumulative logits. I decided to start with the largest category and then going down. Therefore, the probabilities defined were probability to get 4 (after I substract all data by 1), probability to get either 3 or 4, 2,3 or 4 and 1,2,3 or 4. The order in multi should be in decending order. Therefore the largest probability is the one that ahs the largest alpha which is alpha4. The probability to get 1,2,3 or 4 is exp(e4)/(1+exp(e4)) and e4 =alpha4+beta*DORR Then you define the other cumulative probabilities 2,3,4 (exp(e3)/(1+exp(e3)) , 3,4 (exp(e2)/(1+exp(e2)) and 4 (exp(e1)/(1+exp(e1)) . To make sure the prob 1,2,3,4 > prob 2,3,4 > prob 3,4 >prob 4, we started with alpha4>alpha3>alpha2>alpah1 and it worked. The project is attached. best Serge [file name=logistic_regression_polytomous_official_version.phxproj size=346557]http://pharsight.com/extranet/media/kunena/attachments/legacy/files/logistic_regression_polytomous_official_version.phxproj[/file]
Attached Files
-
logistic_regression_polytomous_official_version.phxproj 338.43KB
491 downloads
Edited by Simon Davis, 06 July 2015 - 02:41 PM.
#16
Arindam Pal1412845459
-
- Members
-
- 12 posts
Member
- LocationIndia
Posted 12 September 2017 - 07:17 AM
Hi,
I am trying to find out the drug-response from a cumulative logit of two functions: a "placebo effect" delineating the course of disease progression over time, and a drug response which is a function of effect-site concentration (Ce) described by an effect-compartment sigmoid-Emax model.
I have arranged the sequences as:
sub_ID treat time(h) PID_score per Ce(ng/mL) 1 placebo 0.25 0 0.25 0 1 placebo 0.5 0 0.5 0 1 placebo 0.75 0 0.75 0 68 100mg 0.25 0 0.25 0 68 100mg 0.5 0 0.5 15.9628 68 100mg 0.75 0 0.75 51.914 68 100mg 1 0 1 93.01454
where PID score is categorical response scores (-1,0,1,2,3); to emulate the effect of time, it was recreated as "per"; "Ce" is effect-site conc. Here the covariates are "per" and "Ce" where "per" is discrete and "Ce" is continuous.
I hope the arrangement of sequences is right for execution.
My ques: Going through the above discussion, I guess Serge chose "PK/Linear" model to include the effect of PK (drug), is it essential to run "PK/Linear" in this situation or is it alright to go for only "Linear" as I have already estimated the "Ce" from PK-PD model in Phoenix?
In case, I use the two covariates my "Linear" model structure would be:
e1 = th1 + th5*per + th6*Ce
e2 = th2 + th5*per + th6*Ce
e3 = th3 + th5*per + th6*Ce
e4 = th4 + th5*per + th6*Ce
Kindly correct me if I am doing anything wrong.
Thanks,
Arindam
Edited by Arindam Pal1412845459, 12 September 2017 - 07:42 AM.
#17
Simon Davis
-
- Administrators
-

- 1,342 posts
Advanced Member
Posted 12 September 2017 - 08:12 AM
Arindam, if attaching data, it is much easier to either post a screen shot, or better yet a small CSV as the formatting of columns etc is often not retained. If oyu can edit your post to attach the data file then we can comment better.
Simon.
#18
Arindam Pal1412845459
-
- Members
-
- 12 posts
Member
- LocationIndia
Posted 12 September 2017 - 10:00 AM
Arindam, if attaching data, it is much easier to either post a screen shot, or better yet a small CSV as the formatting of columns etc is often not retained. If oyu can edit your post to attach the data file then we can comment better.
Simon.
I have attached the excel file.
Few info. on background:
- The response is PID score ranging from -1 (worst pain) to 3 (no pain)
- since individual Cp data is not available, I have taken the mean Cp for 100mg and 200mg doses of the drug.
- I tried to build in the same logic as Serge's model was and my script was:
test(){
covariate(per)
covariate(Ce)
e1 = th1 + th5*per + th6*Ce
e2 = th2 + th5*per + th6*Ce
e3 = th3 + th5*per + th6*Ce
e4 = th4 + th5*per + th6*Ce
multi(PID_score,ilogit,e4,e3,e2,e1)
p5=exp(e1)/(1+exp(e1))
p45=exp(e2)/(1+exp(e2))
p345=exp(e3)/(1+exp(e3))
p2345=exp(e4)/(1+exp(e4))
p1=1-p2345
p2=p2345-p345
p3=p345-p45
p4=p45-p5
LL(PID_score,log(PID_score==3 ? p5 : PID_score==2 ? p4 : PID_score==1 ? p3 : PID_score==0 ? p2 : p1))
stparm(th1=tvth1)
stparm(th2=tvth2)
stparm(th3=tvth3)
stparm(th4=tvth4)
stparm(th5=tvth5)
stparm(th6=tvth6)
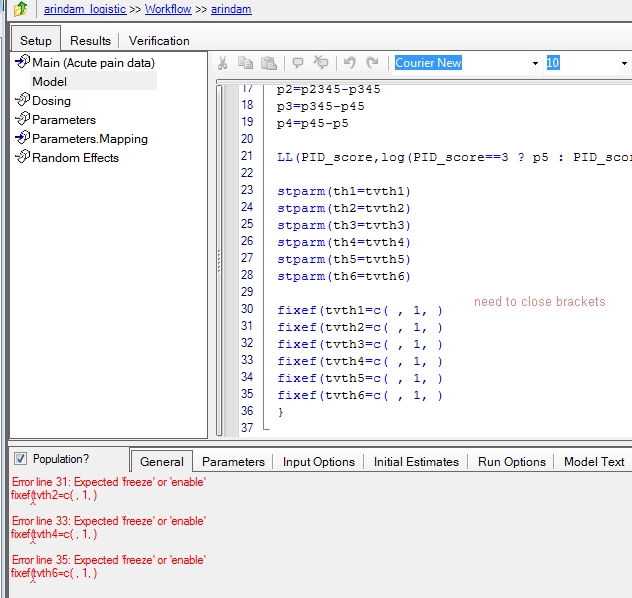
fixef(tvth1=c( , 1, )
fixef(tvth2=c( , 1, )
fixef(tvth3=c( , 1, )
fixef(tvth4=c( , 1, )
fixef(tvth5=c( , 1, )
fixef(tvth6=c( , 1, )
}
Per my data, the lowest probability lies with p5 (with score of 3) and highest with p4 (with score 0).
Running this model, I got a message of "Model execution failed or cancelled"
In the Warnings and error tab of "Results" I found:
"Error in population: Program too big to fit in memory"
Attached Files
-
Acute pain data.xlsx 75.06KB
433 downloads
#19
Arindam Pal1412845459
-
- Members
-
- 12 posts
Member
- LocationIndia
Posted 14 September 2017 - 10:23 AM
Arindam, if attaching data, it is much easier to either post a screen shot, or better yet a small CSV as the formatting of columns etc is often not retained. If oyu can edit your post to attach the data file then we can comment better.
Simon.
Hi Simon,
Have you went through the spreadsheet and the code?
Any suggestion to proceed would be of utmost help.
Best Regards,
Arindam
#20
Simon Davis
-
- Administrators
-
- 1,342 posts
Advanced Member
Posted 15 September 2017 - 11:01 AM
When I copied in your model code I noticed immediately a basic syntax issue; in that you need to close brackets; if you look at the general tab you would have seen the errors noted in red too.
I haven't looked much furhter into you code but I did notice that there is some issue with the code/data still as you get this error in Warnings and errors when I try to execute.
Observable 'PID_score' category probabilities not descending
As I have to go into a meeting for the rest of the day I attach my project(v6.4) so far, you may need to confirm the mappings etc. and of course some initial estimates too.
Simon
PS Note this also being dealt with as Certara Support Case #00163890
Attached Thumbnails
Attached Files
-
arindam_logistic_v64.phxproj 738.13KB
426 downloads
Edited by Simon Davis, 15 September 2017 - 11:03 AM.


0 user(s) are reading this topic
0 members, 0 guests, 0 anonymous users

