Jump to content


Photo

Importance of variuos plots in NLME results


  • Please log in to reply
3 replies to this topic

#1 Vijay Kumar Sripuram

Vijay Kumar Sripuram

    Newbie

  • Members
  • Pip
  • 9 posts

Posted 08 July 2013 - 03:56 AM

Hi all,


This might be a basic question but would help ful for learners like me.


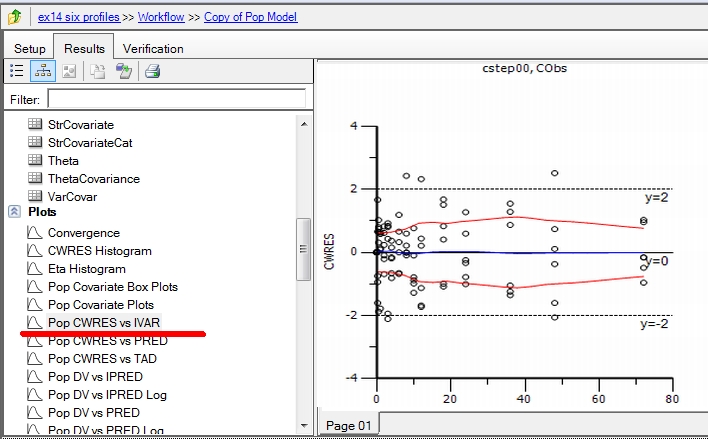
What is the importance of each type of plots observed in NLME results and how to interpret the basic models with covariate models using these plots.


Thank you


VIJAY


#2 Simon Davis

Simon Davis

    Advanced Member

  • Administrators
  • 1,318 posts

Posted 08 July 2013 - 08:27 AM

Hi Vijay,
My first starting point would be to review plot descriptions, under Plot output on page 853 of the Phoenix 1.3 User's Guide.pdf (or equivalent in whatever version you are using.

Beyond the starter suggestions e.g.

Pop CWRES vs IVAR
Plot of CWRES (conditional weighted residuals), a recently proposed replacement for the classical WRES (weighted residuals) goodness of fit statistic, against IVAR, the independent variable (typically IVAR is time in a PK fit, concentration or dose in a PD fit).
Values of CWRES should be approximately N(0,1) and hence concentrated between y=-2 and y=+2. Values significantly above 3 or below -3 are suspect and may indicate a lack of fit and/or model misspecification.

Some references are given for further explanation and back ground reading e.g.

A. C. Hooker, C. E. Staatz, and M. O. Karlsson (2007). Conditional Weighted Residuals
(CWRES): A Model Diagnostic for the FOCE Method, Pharmaceutical Research,
DOI:10.1007/s11095-007-9361-x

Ultimately it does come down to a combination of understanding, expertise and experience, I am sure other readers of this forum can propose their own tips and suggested reading.

For Covariates, try following the example in Chapter 10 "Covariate Modelling" of the NLME Examples guide and seeing how the plots changes as covariates are added to the model. Also if you have a specific project you would like to post as an example then we can perhaps try to work through that.

Simon.

A CWRES vs Time plot showing the parallel LOESS fits indicating relatively even error over the whole time range Posted Image

Attached Thumbnails

  • cwres.jpg


#3 Vijay Kumar Sripuram

Vijay Kumar Sripuram

    Newbie

  • Members
  • Pip
  • 9 posts

Posted 08 July 2013 - 05:28 PM

Hi Davis,


Thanks for your references.


Could you also suggest me how to give subject ID in input file in phoenix modeling for Inter occasion variability.


Is it OK to give same ID in two occasions (for example: the subject ID is 1 and can it be again 1 if the subject is dosed for the second time with the same drug with some co medication this time?)


Best Regards

VIJAY


#4 Simon Davis

Simon Davis

    Advanced Member

  • Administrators
  • 1,318 posts

Posted 19 December 2019 - 01:06 PM

Vijay, we migrated the forum shortly before you posted and I somehow lost notifications from old topics and I only jsut saw this whilst searching for another post!  I am sure you worked it out but yes you coudl do this in a variety of ways.  Use a continuous time from first dose and then have the covariate event happen of comedication.

And/or use e.g period as an interoccasion co variate.  Probably best to provide an example project where people can help you structure your data file and model code. Simon


0 user(s) are reading this topic

0 members, 0 guests, 0 anonymous users