Jump to content


Photo

IVIVC Deconvolution - Cumulative input correction


  • Please log in to reply
4 replies to this topic

#1 Alexandre Caron

Alexandre Caron

    Newbie

  • Members
  • Pip
  • 8 posts

Posted 24 January 2014 - 03:55 PM

Hi everyone,


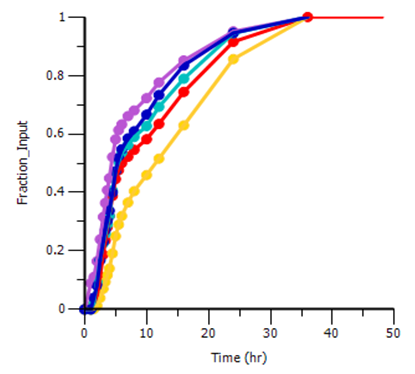
I'm currently running an IVIVC on five different oral formulations (2 generic Test, 1 Reference, 2 formulations used for external verification). I have in vivo PK data and in vitro dissolution data on all five formulations. When I perform the deconvolution of in vivo data, I initially input the administered dose (4 mg for each formulation) and the IV dose for UIR calculation. Now this generates a deconvoluted plot that fails to reach 100% absorption, because I haven't yet corrected the oral dose for BA (30%). At this point, should I correct all five formulations at the same exact BA-corrected dose (30% x 4 mg = 1.2 mg), or should I use individual cumulative input as generated by the deconvolution (last timepoint) for each formulation? By doing the second option, I would input different doses for each formulation, but upon recalculation of the deconvolution I would reach 100% absorption for each formulation.

What bothers me is that doing this individual correction, I get a PK profile different from the original PK data, i.e. the formulation with the steepest absorption slope and higher Cmax, would not necessarily be the most rapid absorbed formulation on the "input-corrected" deconvoluted plot...

Thanks for your input everyone,


Alex

 [img/] [file name=PK.png size=54231]http://pharsight.com/extranet/media/kunena/attachments/legacy/files/PK.png[/file]

Attached Thumbnails

  • PK.png


#2 Alexandre Caron

Alexandre Caron

    Newbie

  • Members
  • Pip
  • 8 posts

Posted 24 January 2014 - 03:57 PM

[file name=Deconvoluted_Individual_Correction.png size=43881]http://pharsight.com/extranet/media/kunena/attachments/legacy/files/Deconvoluted_Individual_Correction.png[/file]

Attached Thumbnails

  • Deconvoluted_Individual_Correction.png

Edited by Simon Davis, 15 March 2017 - 09:35 AM.


#3 Simon Davis

Simon Davis

    Advanced Member

  • Administrators
  • 1,318 posts

Posted 25 January 2014 - 11:21 PM

Alex,


     I wouldn't correct anything. You can try a cutoff time or a Fa adjustment in the IVIVC itself. The IVIVC will only be valid if it can account for how dissolution rate affects bioavailability.


  Simon


#4 Alexandre Caron

Alexandre Caron

    Newbie

  • Members
  • Pip
  • 8 posts

Posted 10 February 2014 - 08:15 PM

Hi Simon,


Thanks for your help.


My understanding was that dissolution data needed to be fixed to Finf = 1, and that PK data needed to be corrected for FD. This way, the correlation would be built on both in vitro and in vivo data covering the full 0 to 100% scale for each formulation.

The problem is that after deconvolution, the profile of the formulations move around and a lower / slower formulation (based on PK data) now becomes the most rapidly absorbed formulation (deconvoluted plot) since I normalized this formulation with a very low FD (cumulative input). This lower FD could be due to the formulation per se, but also due to the variability of the data...


On the other hand, if I don't correct for FD, I get a cumulative input of 1000 ug from a dose of 4000 ug, thus the correlation is built on fewer points: 0, 10 and 20% (Levy plot).


Simon, why would you recommend not to correct for the % of the fraction of the dose?


Many thanks,


Alex


#5 Simon Davis

Simon Davis

    Advanced Member

  • Administrators
  • 1,318 posts

Posted 11 February 2014 - 12:07 PM

Alex, I believe you should let your dissolution data tell what is actually happening; i.e. variability in the actual versus nominal dose if that is the case. It also means that with other dose strengths the model will be able to scale appropriately. Aside from simplifying the number of model parameters I don't see a lot of advantage in fixing FINF at 1. Are you sure you have made your dissolution experiment as biorelevant as you can? e.g. USP4 Are you happy you have the best dissolution model; if you're concerned about number of points in the levy plot you can adjust them here; plot_values.jpg Without seeing your data/ project it is hard to comment further. Simon [file name=levy85_95.jpg size=53771]http://pharsight.com/extranet/media/kunena/attachments/legacy/files/levy85_95.jpg[/file]

Attached Thumbnails

  • levy85_95.jpg
  • plot_values.jpg

Edited by Simon Davis, 15 March 2017 - 09:36 AM.


0 user(s) are reading this topic

0 members, 0 guests, 0 anonymous users