Hi aal,
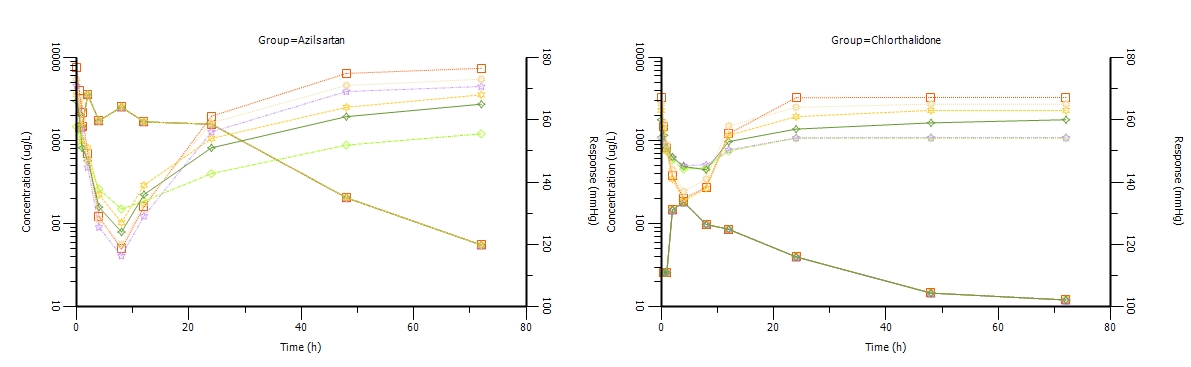
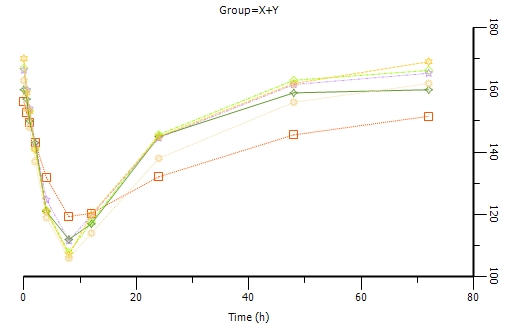
the objective of our study was to develop synergistic PK-PD interaction between two drugs X and Y for anti-hypertensive activity. We have tried to develop e the interaction model through Indirect response models that simultaneously act on different rate processes Kin and Kout. Naive pooled method was use for analysis.
But we faced following problems in modeling
1. we could n't be able to get precise parameter estimates
2.We could not be able to get estimates of Emax and EC50
Kindly suggest the corrections to be made in model code if any, or suggest the wys to refine the model in terms of ensuring good parameter estimates.
The phoenix file was attached below.