Hi LLLi,
In your reply, you mentioned "Formulas: θ’L,=[1+ln(θL)/ln(r )] and θ’U=[1+ln(θU)/ln(r)]. From [0.8, 1.25] and r 10 we get [0.9031, 1.0969] and from [0.5, 2] and r 10 [0.6990, 1.3010]".
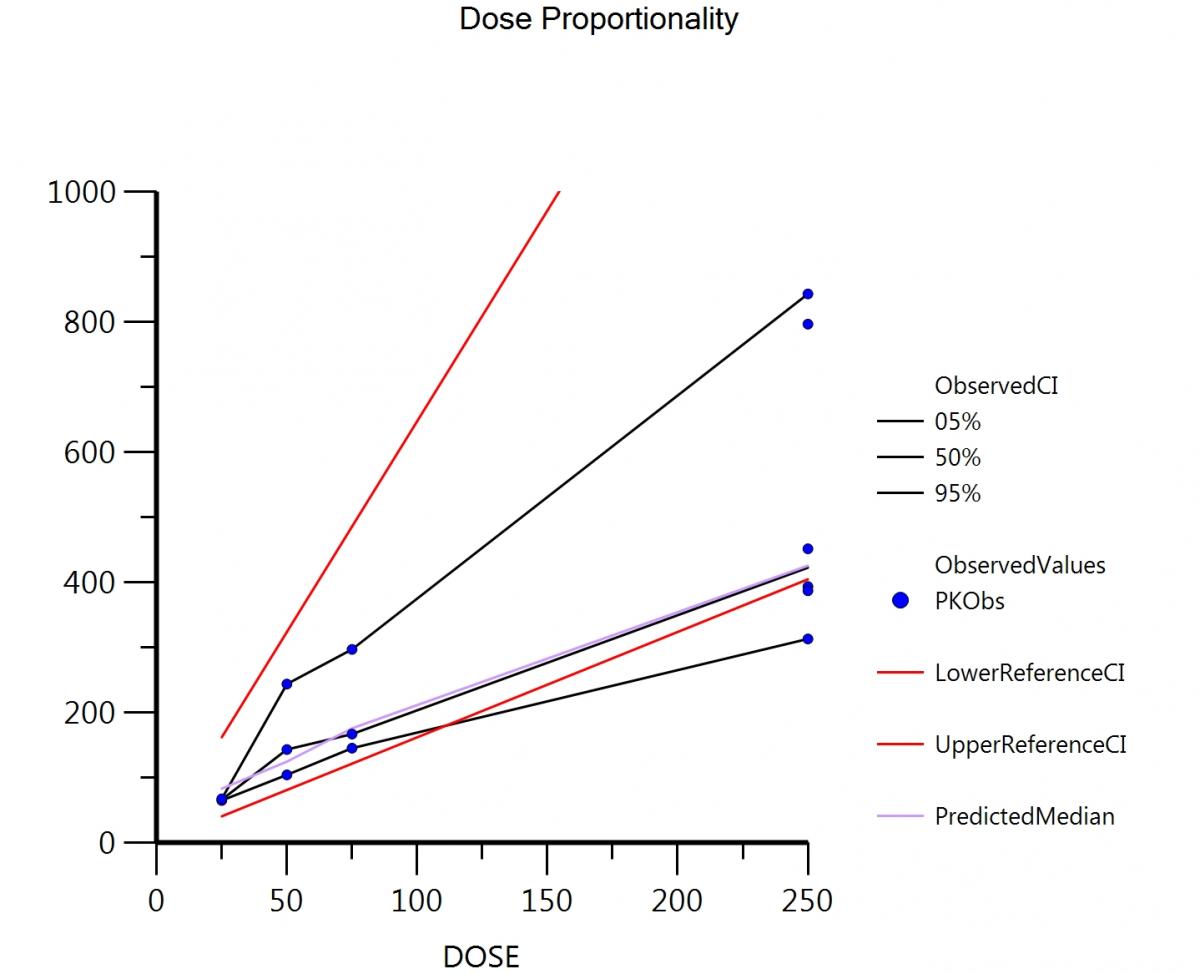
While in Smith's paper, it is said that "the CI of Rdnm completely outside (0.8, 1.25), indicating a disproportionate increase". I am confused about the difference between the reference interval. Which reference interval we should use to evalute whether DP or not?
You are quoting the footnote b below Table 2. I guess this is just a typo. Smith used a slightly different terminology (compared to Chow/Liu and Hummel et al.). He starts from 0.80 and 1.25 (ΘL and ΘU; page 1279, first paragraph). The transformed acceptance range (he calls it “the critical region” and later “the reference interval”) is derived in Eq. (4). That’s the same one I used above. Now look at page 1282, left column, second paragraph, which reads:
The corresponding 90% CI (0.679, 0.844) fell outside the reference interval (0.903, 1.097) defined by Eq. (4) for r = 10 and ΘU = 1/ΘL = 1.25, indicating a disproportionate change in Cmax across the dose range studied.
In other words from the original range [0.80, 1.25] he gets the transformed one [0.903, 1.097] and this is what you should use (of course depending on the actual r in the study). q.e.d.
Furthermore, the paper also said that the Rdnm value of 1 would denote ideal dose-proportionality.
Correct. Let β ≡ 1 and r ⊂ ℝ. Then Rdnm = r β–1 = r 0 = 1. Less mathematical: If the slope is exactly 1 then for any possible ratio of dose levels Rdnm will be exactly 1.
Rdnm = PK/corresponding dose?
No. r = the ratio of the highest/lowest dose and Rdnm = r β–1. You do not dose-normalize in this model.
For power model of Rdnm, what is Y and what is x?
In my project I used the linearized power model, which is
ln(Yj) = α + β · ln(xj),
where Y is he respective PK metric (AUC, Cmax, …) and x the dose; both at level j. Most people prefer the linearized model over the original one – which is
Yj = α · xj β
because the latter requires nonlinear fitting. If you have a Phoenix/NLME license go ahead with the “pure” model. Anyhow, I would not recommend that because in a regulatory setting the former is more easy to assess than the latter.
However, there is a situation which demands nonlinear fitting: A power model with an intercept, i.e.,
Yj = α + λ · xj β.
You would need this model for dosing an endogenous compound and measurable basal levels.


 Smith et al 2000.phxproj 1.08MB
1029 downloads
Smith et al 2000.phxproj 1.08MB
1029 downloads