

Dear all.
I have to admit that we are still running 6.3, waiting for 7 as our next step for implementation (never touch a running system, kind of).
Due to some miscalculation from my side I had a look into the result I got from a quick NPS today and observed something I was not able to understand (or resolve). Fortunately the values in the end still somehow match with my (corrected) calculations by hand, but still
I would like to ask, whether someone had observed something similar and might give some hints what I did wrong here.
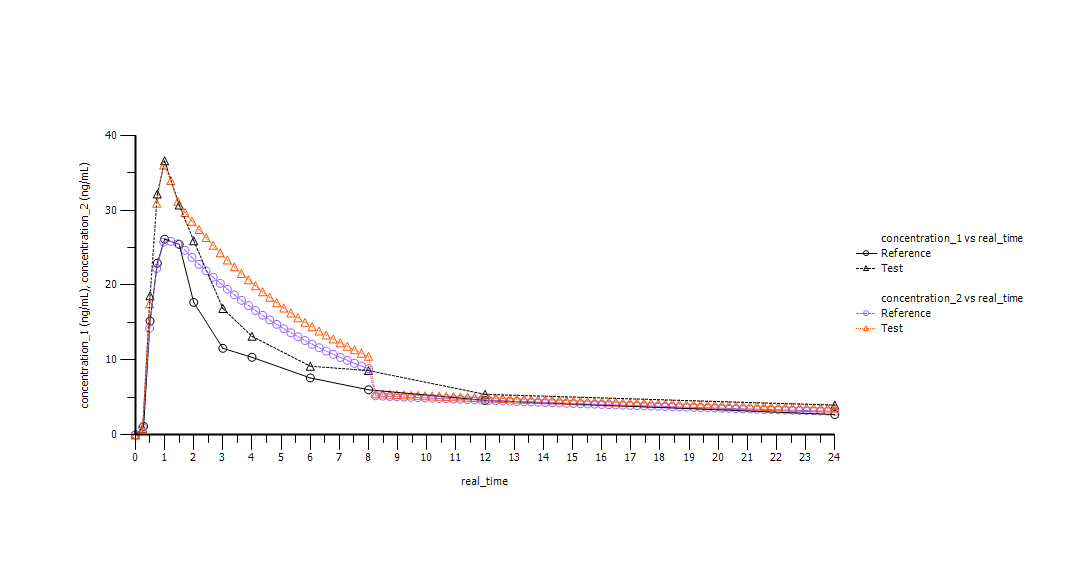
For demonstration I provide one of the data sets: 1 subject, two products (I changed them to R and T naturally).
This was subject to the NPS object (sorted by treatment, regular dosing, 100 points, log-calculation, doses 1/1, Tau 24 (note: I did change the "display", number of points (24, 1441...) and Tau to several other values without a change in the dubious output; Lz was estimated from 8-72 for Reference and from 36-72 for Test (based on NCA)).
What I got when I compared the original data with the 1st dose was the profiles also attached.
In this (and all other subjects, some to a lesser degree, some even more clearly) the predicted concentrations failed to match the original data starting at 2 hours and showed a sharp decline at about 8 hours (there are even subjects with multipeaks until 2 hours that are nicely matched, but afterwards ...).
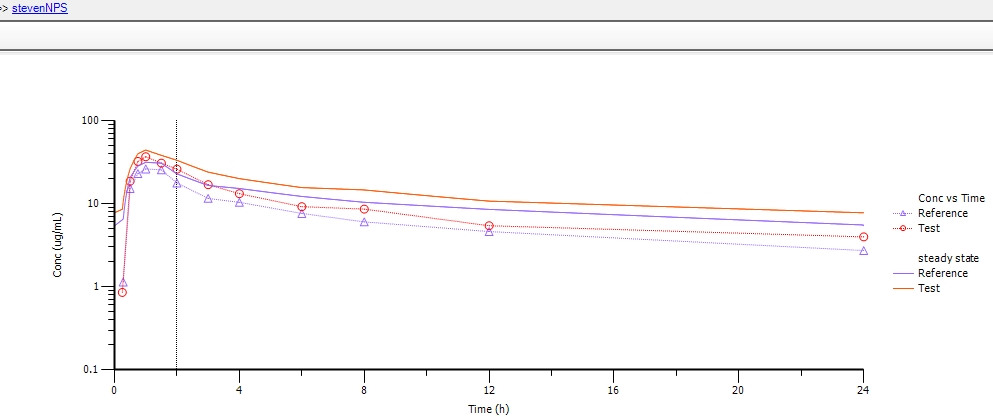
As I expected, that for "Display 1st dose" the profiles should be superimposable, I found this interesting. However, at least the sharp decrease at 8 hours is also clearly visible for displays at steady-state (the start of mismatching at 2 h not quite as clearly (higher concentrations/accumulation etc.) and here I started to worry, whether my calculations/values I would like to use for further assessments are correct.
As said, I would highly appreciate any input on what went wrong here and I will be really happy, if this is something that I did wrong (because that would naturally be the most comfortable issue to correct).
Please do not hesitate to ask for any further information I forgot to provide and thanks for reading!.
Best regards,
Steven.
Attached Thumbnails
Attached Files
-
 Sample Data NPS.xlsx 9.52KB
371 downloads
Sample Data NPS.xlsx 9.52KB
371 downloads
 .
. ).
).


