Below you will find responses of the Q&A session for this webinar:
Question: Is it mandatory to keep similar units for concentration and dose?
Answer: The NLME engine of the Phoenix Model object does not perform unit conversion. Therefore the modeler must account for the units. The best practice is to use the same mass units for concentration and dose. That puts volume in the same units as in concentration. For example, concentration is ng/mL and dose is ng, therefore volume parameters are in mL.
Question: Why was urine volume included in the analysis? There was a step to transform urine data to concentration. Does that model not work with amount?
Answer: The conversion of amounts excreted to urine-concentration using the collected urine volume was required for the NCA analysis. The NCA analysis on the urine data was done to get an initial estimate. For the Phoenix model we have used the amount excreted as observations.
Question: Can you explain the naive pooled method- why is it needed?
Answer: Here there is a single subject so only naive pooled fitting can be done (not FOCE-ELS)
Question: Is it a must to have NLME license in order to do these population analysis?
Answer: The exercise that we presented was not a “full” population analysis, rather we used the population mode to simultaneously fit data from two inputs from a single subject. The Phoenix WinNonlin license allows you to run the Phoenix model with the Naïve-Pooled method for individual fitting only. Note that it is not possible to estimate between subject variability with the naïve pooled method. For population analysis of datasets with multiple subjects you would need a Phoenix NLME license.
Question: What should be the initial estimate for the standard deviation of the residual error? Why did you start with 0.3?
Answer: If using an additive error model, the standard deviation (SD) of the residuals is the same order of magnitude as the actual data. “1” often works, but if the observations are quite large you may need to increase the initial estimate of the SD to be comparable with the observations. When using a multiplicative error model, the SD (for small values) is an approximate CV. The within subject CV is generally in the range of 10 to 30% for most drugs, hence we used a value of .3 here.
Question: Is the model shown in the text book where the example came from?
Answer: Yes, all models are described and explained in the Gabrielsson and Weiner book. The book comes with a memory stick where all project files are stored. You can load those project files directly into Phoenix and it will show you the dataset and the model including results.
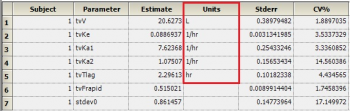
Question: Why does the theta sheet not contain units for all parameters?
Answer: The theta sheet contains units for volume, clearance, Tlag and Ka. It does not show units for fraction excreted (Fe) and Bioavailability (F) since these parameters are unit less. Note that these are not derived – rather they are just carried over from NCA or the initial dataset.
Question: Here we didn't calculate Renal Clearance. How would you do this with this model/dataset?
Answer: Renal clearance is calculated from the cumulative amount excreted (Ae) and the AUC of plasma concentrations over the sampled time or a particular time interval. Both values, Ae and AUC can be extracted from NCA analysis: Ae is output from urine NCA and AUClast (or any partial areas) is output from plasma NCA. You would just join these outputs into a single worksheet and perform a transformation using the Data Wizard to calculate the renal clearance. Alternatively, renal clearance can be computed as a secondary parameter in your model as the product of Cl and fe (fraction excreted via the urine).
Question: What if you have multiple subjects to model. Would that also work with the population "naive pooled" option?
Answer: Yes, naive pooled will also work with multiple subjects. In the main mapping of the Phoenix model you would need to map your subject identifier as a sort key. Your Route information will still be mapped as ID. After the fitting you will have individual values for each subject.
Question: How can we access the presentation after the event?
Answer: All materials and the link to the recorded webinar will be made available to Certara Forum:
https://support.certara.com/forums/forum/34-pml-school/
We will post the video also on our Certara YouTube channel:
https://www.youtube.com/playlist?list=PLKuhVJbfbp0z4oDz0Lg7NAzr46qR1MLCM
Question: I noticed that you had CEps used for both observations points. Shouldn't they be different?
Answer: The residual error for plasma concentration, CEps can be used for the urine observations as well. However, given the different numerical range for plasma concentration and amounts in urine, a different estimate, AeEps, for the standard deviation of the corresponding residual errors should be used.
Question: If I have sparse data (IV and PO) from few subjects, how will my VPC plot look in population analysis mode? Will it show individual line fits for all subjects?
Answer: This exercise was not about population analysis, since VPC is a typical diagnostic plot for nonlinear-mixed effect models. In general, the spread of values in the VPC plot depends on the size of the between-subject-variability (BSV). If you have limited BSV the spread will be narrow, if you have large BSV the spread will be wide. The VPC will typically not show any fits for individual subjects, only confidence intervals around predicted and observed quantiles will be displayed.
Question: Will you be able to share the Phoenix raw data file this time and whole PML training with students? So we can continue to digest each step of Modeling offline.
Answer: Only the textual model can be shared with the audience. If you want access to the project file and raw data files you would need to get a copy of Gabrielsson and Weiner book. It is available from Amazon:
https://www.amazon.c...and gabrielsson
Question: If I want to simultaneously fit one IV data and 5 oral data with multiple dose levels. How to do it?
Answer: You can set up the model just as we demonstrated. You would need to define the different dose levels as a sort key in the main mapping and provide the dosing information in the dosing section of the Model setup. If you only have a single subject for each dose/route, you could also fit all curves simultaneously by using the Population option instead of the sort key.
Question: I saw that the bioavailability showed values above 1, how can you explain this?
Answer: This observation is correct and it is unexpected since bioavailability cannot exceed 1 and the situation can be explained by a too low estimation of the AUC value for the IV curve. Further details are discussed in Gabrielsson and Weiner book. In practice, with “real” data, in some instances your initial estimate might exceed 1. But in those instances just using 1 as the initial estimate would be appropriate and we should have done that here. But this did not impact the resultant fit as the final estimate was less than 1.


 PK6.txt 1.23KB
982 downloads
PK6.txt 1.23KB
982 downloads PK6_Final.pdf 514.03KB
1442 downloads
PK6_Final.pdf 514.03KB
1442 downloads


