Hi Harish, I am a little confused by your project, you seemed to have different units of time for IV and ORAL data, once i resolved that If I understand your doses (5mg IV and 200 mg Oral) then your bioavaialbility is very low indeed. Although you did have mg/kg set in the IV dosing, if you oral dose was not weight normalised then please calculate the actual IV dose adminstered and enter that instead.
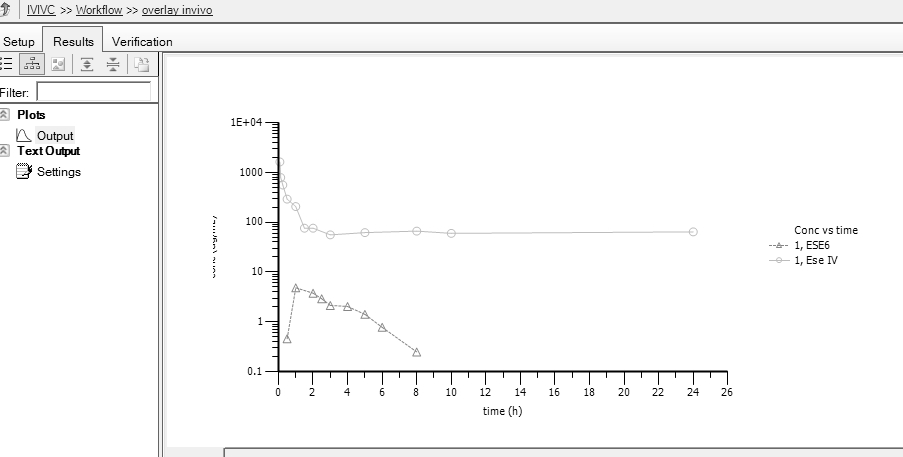
The assumptions of Wagner-Nelson are that you have one compartment, whereas you IV clearly shows more than one phase, 3 I think. It is also rather odd that your IV profile has very different look in the elimination phase to your oral profile - I don't suppose you are dosing a biologic are you?
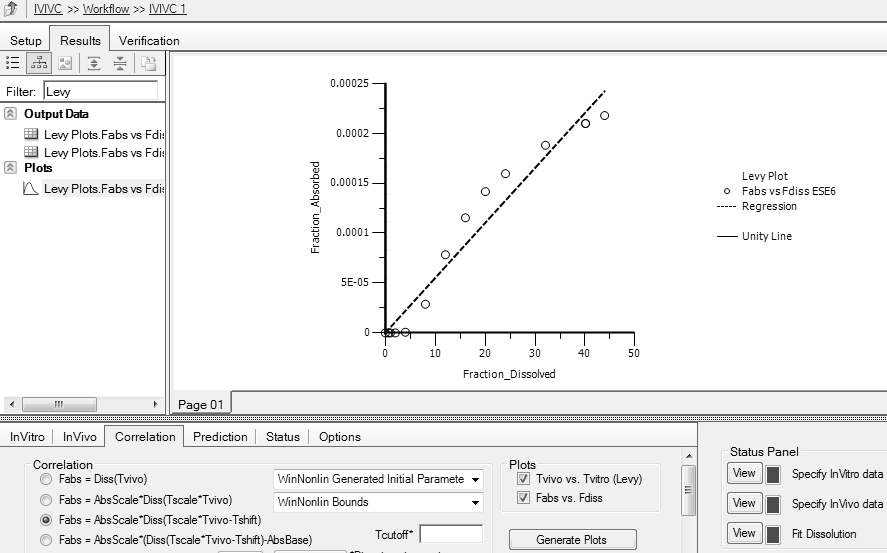
Nonetheless, I just set up an IVIVC anew and used you data as it came and got the Fabs vs Fdiss plot with no issues.
ALso generally the IVIVC tool expects at least two formulations to have been run in vivo in order to build a correlation model.
Hope this helps a little.
Simon.
Edited by Simon Davis, 10 January 2017 - 02:31 PM.


 IVIVC.phxproj 3.92MB
645 downloads
IVIVC.phxproj 3.92MB
645 downloads