Jump to content


Photo

IVIVC - deconvolution of in vivo data


  • Please log in to reply
1 reply to this topic

#1 Maria100

Maria100

    Newbie

  • Members
  • Pip
  • 1 posts

Posted 18 November 2021 - 08:42 AM

Dear Certara Team,


We are using the IVIVC Toolkit to perform IVIVC for a sustained release injectable microparticle system administered subcutaneously.


In the deconvolution step (vivo tab), we are applying the following settings (Attachment 1).


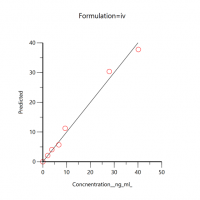
As a UIR, we are using IV infusion data, attached is the graph Y obs. vs Y pred. (Attachment 2), that looks like they correlate nicely.


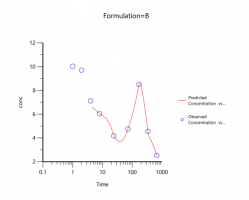
When our in vivo data are deconvolved, we get the following prediction profile (plasma conc vs time - Attachment 3), where it appears that the deconvolution calculations do not describe well the initial burst peak.


Could you please advise us whether we have got something wrong in the set-up or whether there might be a way to improve our prediction profile?


Any input would be very much appreciated! Please let us know if we can provide more info.


Looking forward to hearing back.


Best,

Maria


Attached Thumbnails

  • Attachment 2.png
  • Attachment 1.png
  • Attachment 3.png

  • Naitoeste, Bryanruils, Deborahded and 1 other like this

#2 Simon Davis

Simon Davis

    Advanced Member

  • Administrators
  • 1,331 posts

Posted 18 November 2021 - 10:10 AM

Hi Maria, it is hard to say without seeing more of the actual data you are using.  However I think a sustained release injectable microparticle system administered subcutaneously may well need to have some sort of custom model built as the usual assumptions of IVIVC built in models are not  necessarily valid any more.   You may need to look at a consulting project

How many 'test' forms do you have? to build an IVIVC you will need at an absolute minimum two. 


 Simon.


0 user(s) are reading this topic

0 members, 0 guests, 0 anonymous users