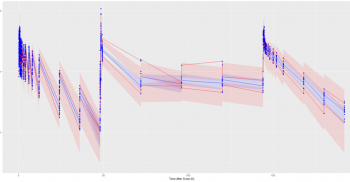
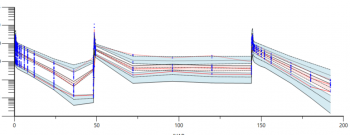
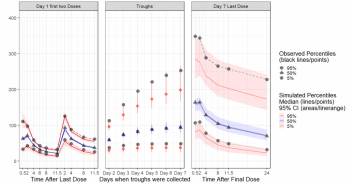
For custom VPCs you may want to invest some time in learning the tidyvpc package in R.
You can easily use Phoenix VPC output (as well as RsNLME, NONMEM, any engine really as the only required inputs are the observed data and simulation data)
Here's an example of how to use output from a Phoenix VPC run. You will need to locate the required files in your Phoenix Temporary Output Folder, the path of which can be found in the compiler output text file from the run.
library(xpose)
# Import obs/sim tables from Phoenix Temporary Output Folder
obs_data <- read.csv("C:/Users/username/AppData/Local/Temp/Phoenix/DME_PredCheck_11-21-24.845__63bc3ae3-ebfd-452a-b2ab-2dc9ccfd44ee/predcheck0.csv")
sim_data <- read.csv("C:/Users/username/AppData/Local/Temp/Phoenix/DME_PredCheck_11-21-24.845__63bc3ae3-ebfd-452a-b2ab-2dc9ccfd44ee/predout.csv")
library(tidyvpc)
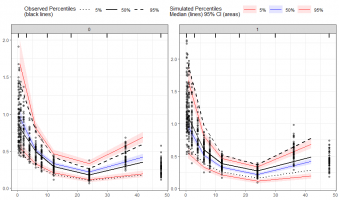
vpc <- observed(obs_data, x = IVAR, y = DV) %>%
simulated(sim_data, ysim = DV) %>%
stratify(~ Strat1) %>%
binning(bin = "jenks", nbins = 5) %>%
vpcstats()
plot(vpc)
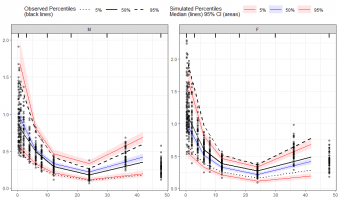
#to add labels to panels: Need to convert numeric variables to factors with labels
obs_data <- obs_data %>%
mutate(SEXfactor = factor(Strat1, levels=c(0,1), labels=c("M","F")))
sim_data <- sim_data %>%
mutate(SEXfactor = factor(STRAT1, levels=c(0,1), labels=c("M","F")))
vpc <- observed(obs_data, x = IVAR, y = DV) %>%
simulated(sim_data, ysim = DV) %>%
stratify(~ SEXfactor) %>%
binning(bin = "jenks", nbins = 5) %>%
vpcstats()
plot(vpc)
# Or use VPCResults User Interface to Explore binning methods
library(Certara.VPCResults)
vpcResultsUI(observed = obs_data, simulated = sim_data)


