Jump to content


Photo

NCA Results Plots

NCA Plots Plot Number of plots

  • Please log in to reply
2 replies to this topic

#1 BEQool

BEQool

    Member

  • Val_Members
  • PipPip
  • 10 posts

Posted 25 August 2023 - 01:43 PM

Hello all!


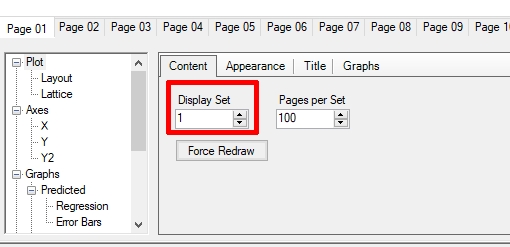
When doing an NCA in Phoenix WinNonlin the maximum number of plots shown under "Results>>Plots>>Observed Y and Predicted Y vs X" is 100. When sample size is large enough (N>50 in a 2-period designs, N>33 in 3-period designs...), one cannot see all plots under this section as the maximum number of plots shown is 100 (for example in a 2-period design there are no plots of subjects over #50). Is there any way to overcome this problem so that we could see all of the plots?


Best regards,

BEQool


  • DonaldKiz likes this

#2 Simon Davis

Simon Davis

    Advanced Member

  • Administrators
  • 1,318 posts

Posted 25 August 2023 - 02:39 PM

If you double click the plot name under results you open it up for formatting, then you can select the display set;


Attached Thumbnails

  • display set.jpg

  • Austingar likes this

#3 BEQool

BEQool

    Member

  • Val_Members
  • PipPip
  • 10 posts

Posted 28 August 2023 - 12:41 PM

Thank you, it works!


Regards

BEQool


Also tagged with one or more of these keywords: NCA, Plots, Plot, Number of plots

0 user(s) are reading this topic

0 members, 0 guests, 0 anonymous users