Jump to content


Photo

Box plot data labels


  • Please log in to reply
2 replies to this topic

#1 jprell

jprell

    Member

  • Members
  • PipPip
  • 23 posts

Posted 05 December 2023 - 09:47 AM

Dear all,


is there any effective way how to display data labels for outliers on the box plot? I would like to see a subject number and the y-value..

Using Annotations does not seen to me as a correct way how to do that...


Thanks, Jan.


Cmax.jpg


Attached File  Outliers.phxproj   83.46KB   26 downloads


  • AlexKawn, RonaldAxon and BrandonPef like this

#2 Simon Davis

Simon Davis

    Advanced Member

  • Administrators
  • 1,318 posts

Posted 06 December 2023 - 02:07 PM

Jan, this is a good request that i've noted with the product manager but although you can do this with XY plots it is not currently possible with the box plot.

With the box plot do you think you would want to label all points or just outliers?


in the mean time, annotations is probably your best work around, but realise this gets tiresome if you have a lot.


  Simon.

Attached Thumbnails

  • annotations.jpg

Attached Files


#3 jprell

jprell

    Member

  • Members
  • PipPip
  • 23 posts

Posted 08 December 2023 - 06:46 AM

Dear Simon,


thank you very much for your answer and sorry for my late response.

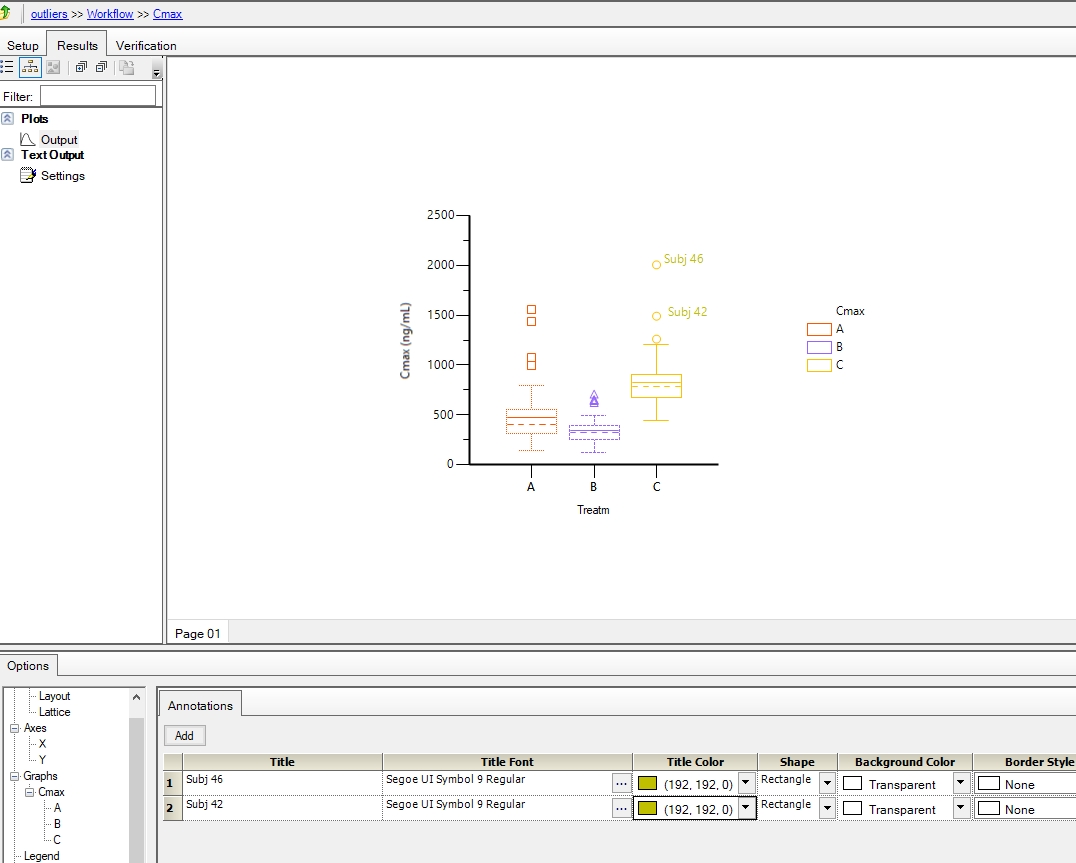
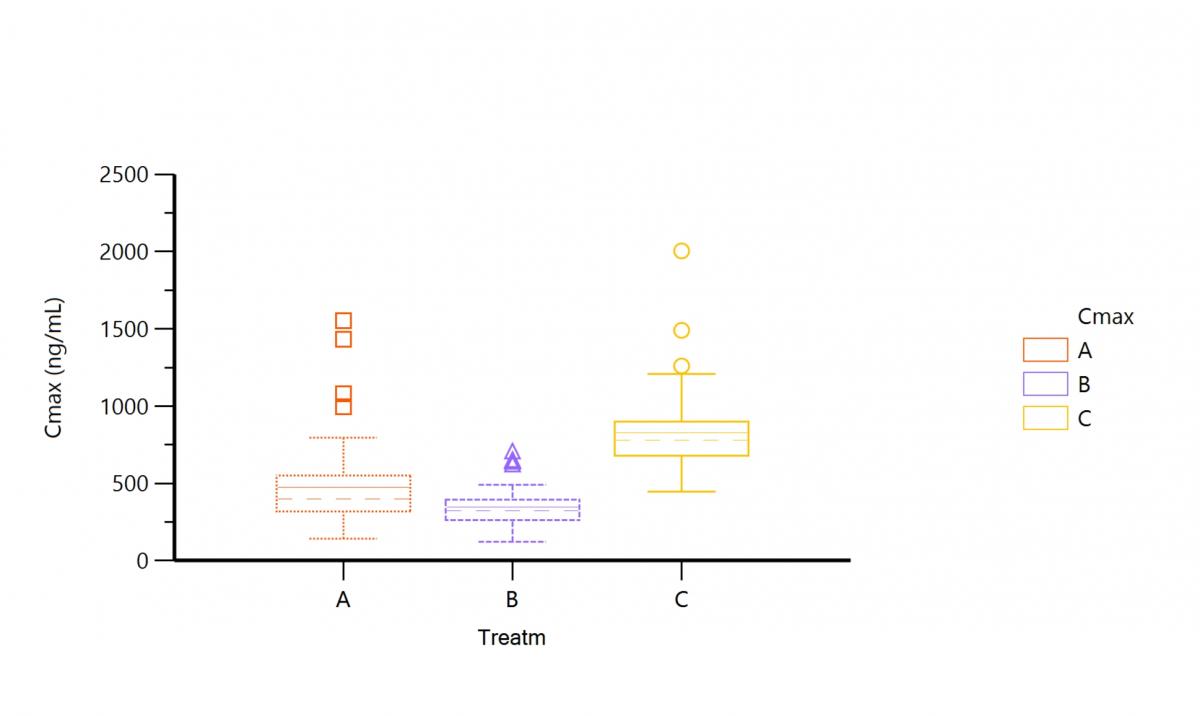
I meant to label just the outliers. So I am looking forward to this option next release! :)


Thanks again and have a nice day, Jan.


Jan, this is a good request that i've noted with the product manager but although you can do this with XY plots it is not currently possible with the box plot.

With the box plot do you think you would want to label all points or just outliers?


in the mean time, annotations is probably your best work around, but realise this gets tiresome if you have a lot.


  Simon.


0 user(s) are reading this topic

0 members, 0 guests, 0 anonymous users