Jump to content


Photo

Questions about plots CWRES-IVAR and CWRES-TAD


  • Please log in to reply
6 replies to this topic

#1 zzzZ

zzzZ

    Newbie

  • Val_Members
  • Pip
  • 6 posts

Posted 26 February 2024 - 07:31 AM

Dear all,
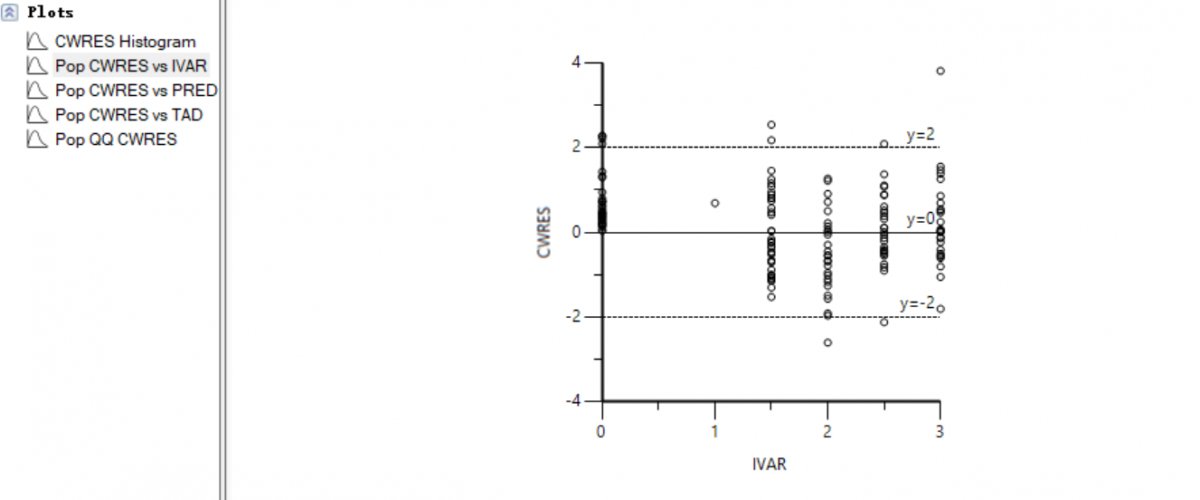
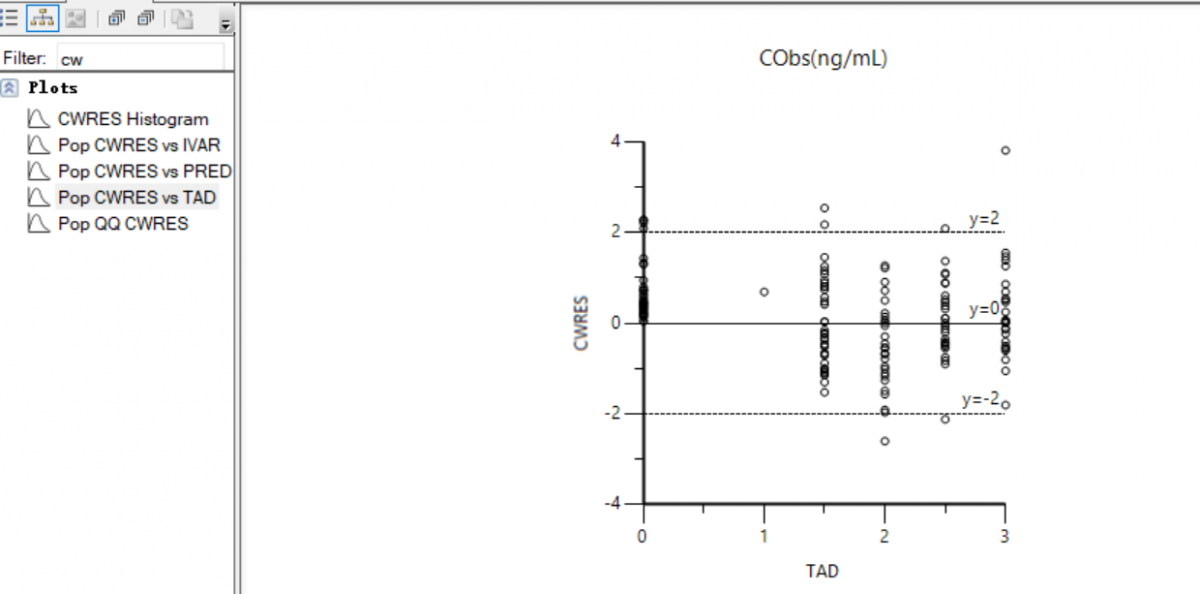
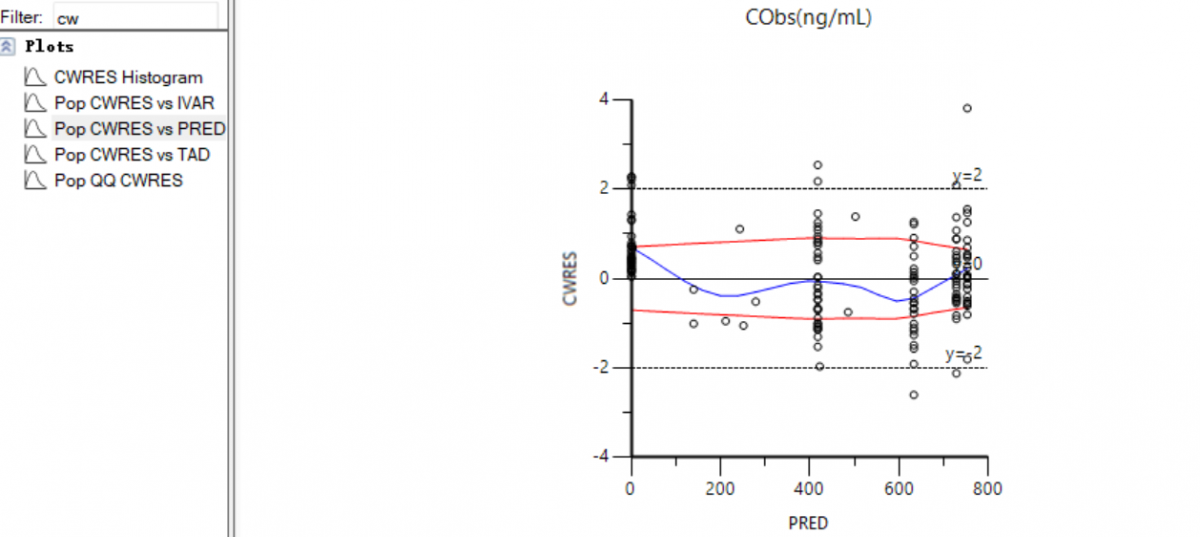
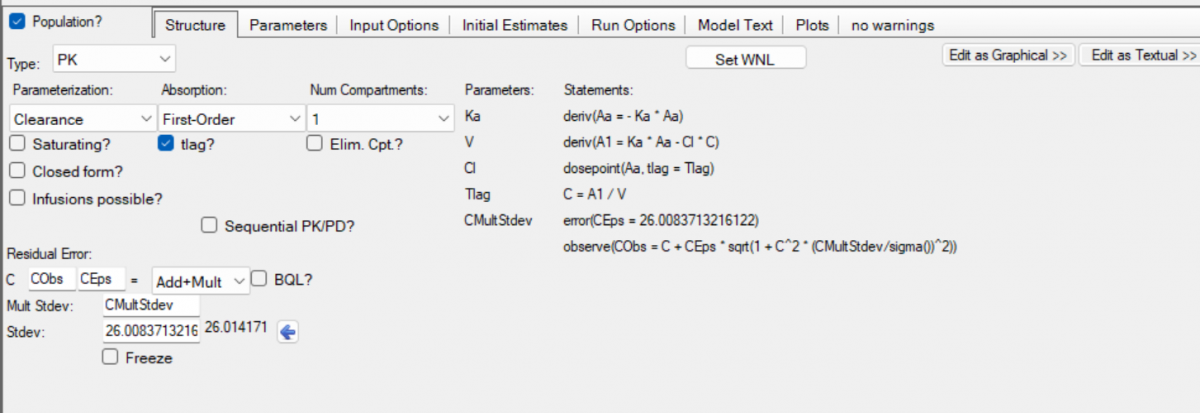
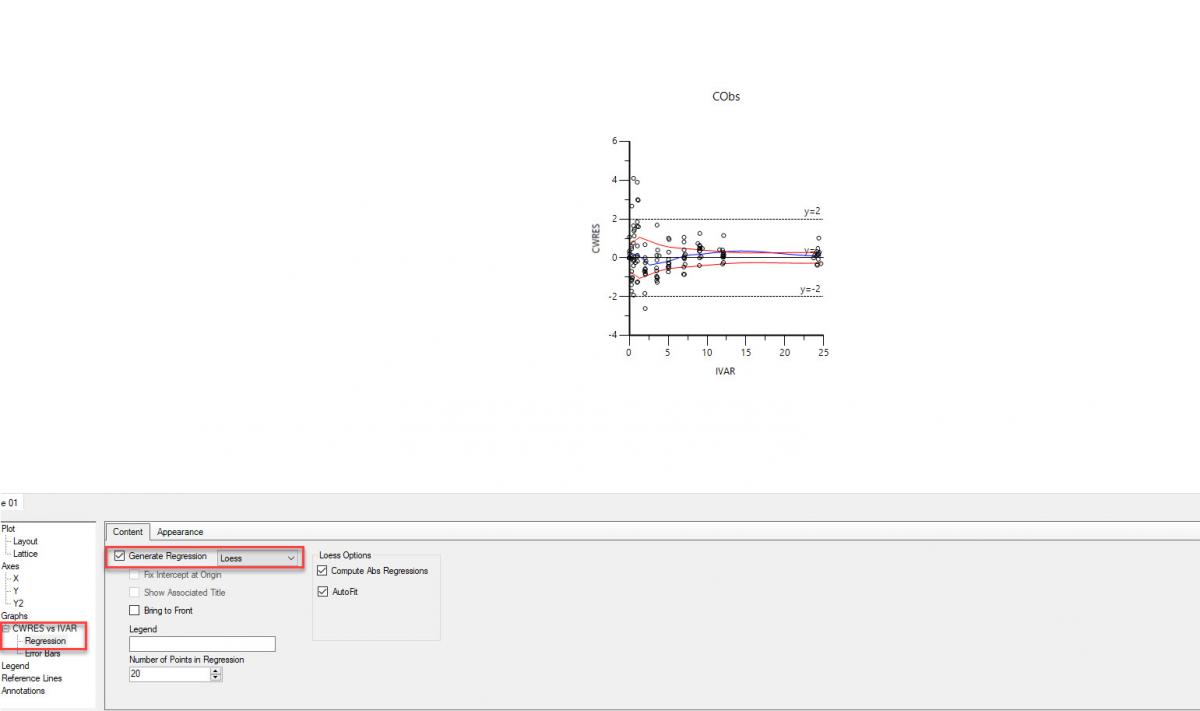
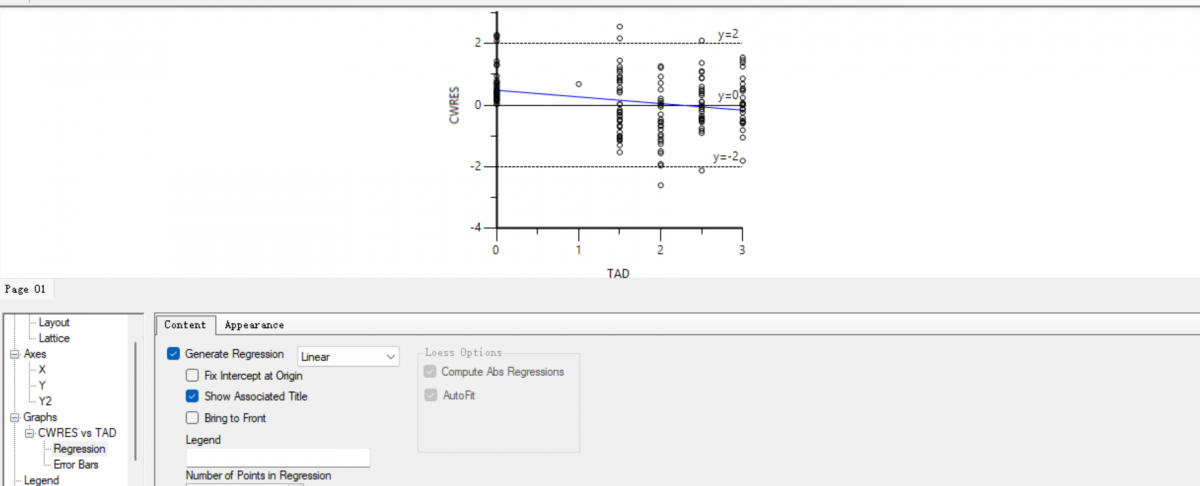
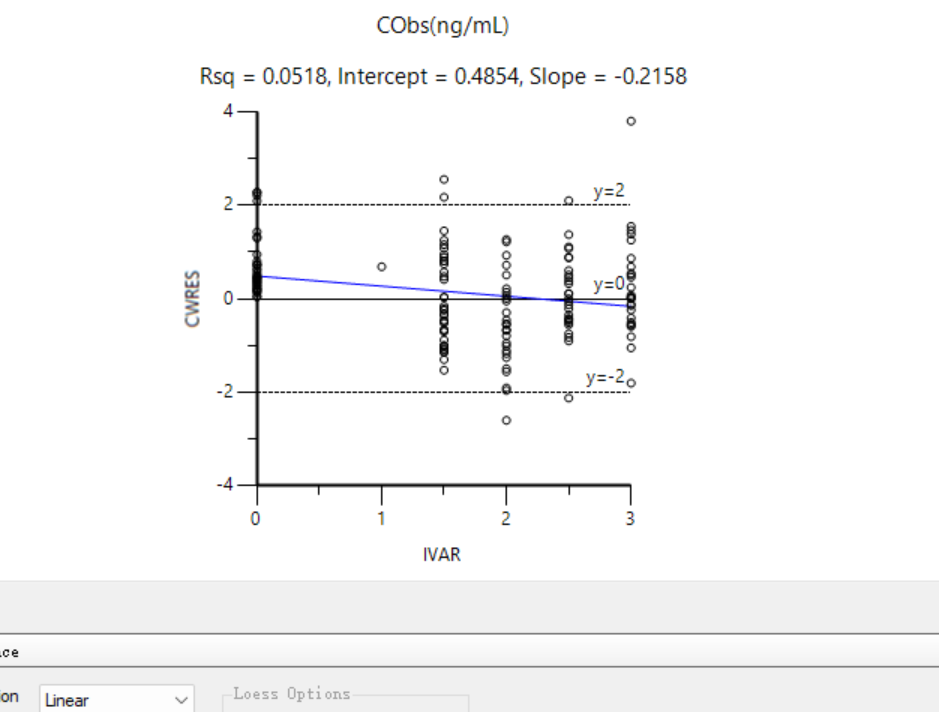
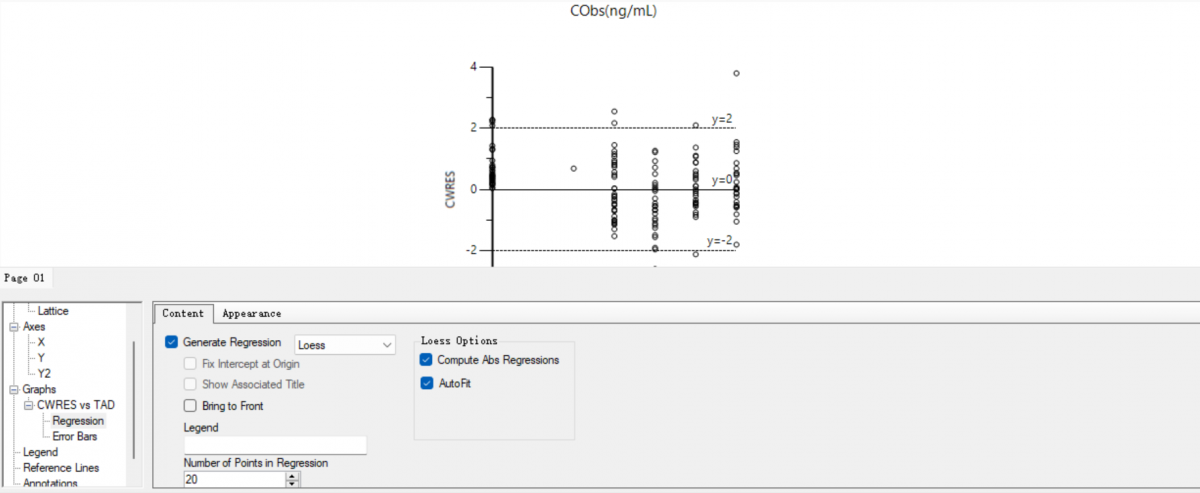
       Thanks for your reading!I’m a student who is learning population pharmacokinetic modeling using Phoenix NLME. In my Pop CWRES-IVAR plot and Pop CWRES-TAD plot, there is always no blue and red lines regadless of the residual error using additive, multiplcicative, mix ratio and so on. Why? Does this matter? How can I solve it?
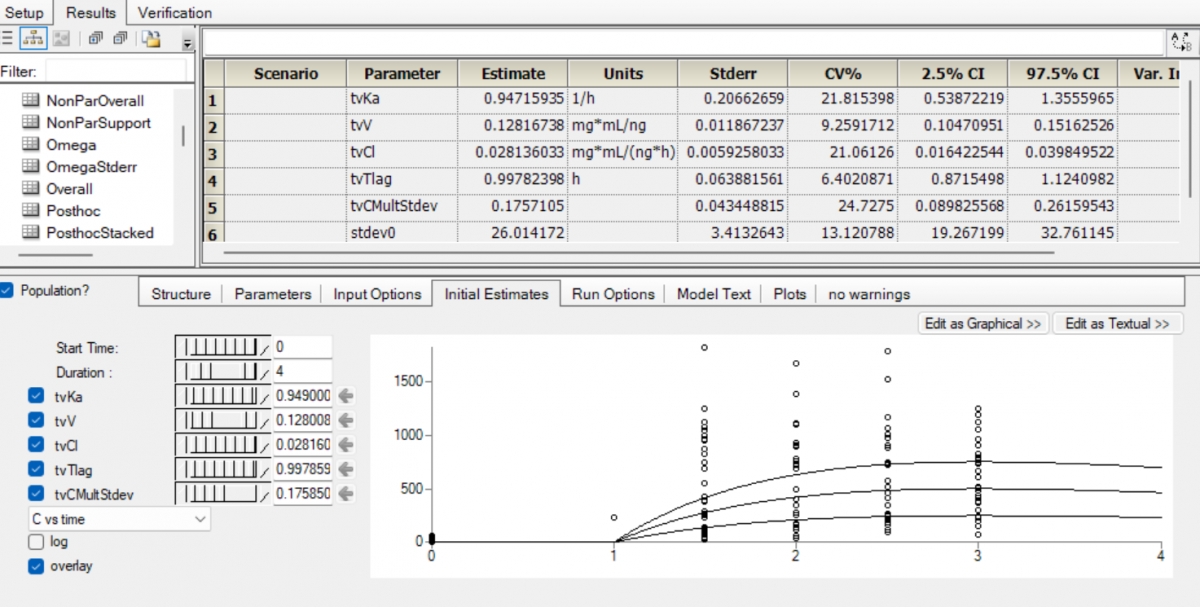
       The total sample size was 157 from 38 patients. The blood collection times were mostly at 0, 1.5, 2, 2.5, 3 h, and partly at 0, 1.5h.
       Hope for your answers! Grateful!

  • StevenTuh, DanielGon, Austingar and 12 others like this

#2 zzzZ

zzzZ

    Newbie

  • Val_Members
  • Pip
  • 6 posts

Posted 26 February 2024 - 07:33 AM

There are some attaches.

Attached Thumbnails

  • 1.png
  • 2.png
  • 3.png
  • 4.png
  • 5.png
  • ss.png

Edited by zzzZ, 26 February 2024 - 07:42 AM.


#3 cradhakr

cradhakr

    Advanced Member

  • Val_Members
  • PipPipPip
  • 78 posts

Posted 26 February 2024 - 08:23 AM

Hi, 


Could you please do the following.


1. double click on the plot >> Plot will open in a new window

2. check if the settings are enabled (image below)


Thanks

Mouli

Attached Thumbnails

  • Plots.jpg

Edited by cradhakr, 26 February 2024 - 08:24 AM.

  • zzzZ likes this

#4 zzzZ

zzzZ

    Newbie

  • Val_Members
  • Pip
  • 6 posts

Posted 26 February 2024 - 08:52 AM

Thanks for your help. I have checked as your advice, but the settings do not seem to be a problem?

Hi, 


Could you please do the following.


1. double click on the plot >> Plot will open in a new window

2. check if the settings are enabled (image below)


Thanks

Mouli

Attached Thumbnails

  • ss.png

Edited by zzzZ, 26 February 2024 - 08:57 AM.


#5 zzzZ

zzzZ

    Newbie

  • Val_Members
  • Pip
  • 6 posts

Posted 26 February 2024 - 09:06 AM

If the loess is changed to linear, there is a blue line. Can this show a satisfactory fitting? 

Hi, 


Could you please do the following.


1. double click on the plot >> Plot will open in a new window

2. check if the settings are enabled (image below)


Thanks

Mouli

Attached Thumbnails

  • 7.png
  • 8.png

Edited by zzzZ, 26 February 2024 - 09:08 AM.


#6 cradhakr

cradhakr

    Advanced Member

  • Val_Members
  • PipPipPip
  • 78 posts

Posted 26 February 2024 - 11:19 AM

Hi could you change the graph from "Linear," to "Loess." You will get bothe the red and the blue line.


Thanks

Mouli


#7 zzzZ

zzzZ

    Newbie

  • Val_Members
  • Pip
  • 6 posts

Posted 26 February 2024 - 11:54 AM

Hi Mouli, the attachment is the result if i choose loess (no blue or red lines).

Hi could you change the graph from "Linear," to "Loess." You will get bothe the red and the blue line.


Thanks

Mouli


Attached Thumbnails

  • ss.png


0 user(s) are reading this topic

0 members, 0 guests, 0 anonymous users