Hi Linda,
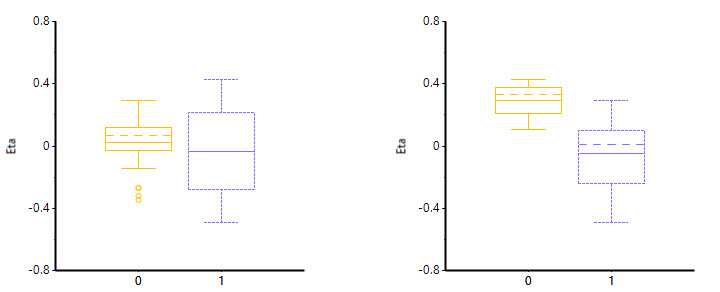
The Pop Covariate Boxplots show the eta distribution by covariate category. It can give you a hint as to what covariates might be added to your model to explain some of the unexplained variability. If you look at the 2 plots below, the one on the left shows eta distributions that largely overlap with more spread in the distribution for category 1, but no obvious shift in the distribution for 1 vs 0. On the right however, you see that category 0 has an obvious shift where the median eta is up around 0.3, and the distributions don't overlap very much. One might expect that when the covariate on the right is added to the model, there will be an improvement to the model.
The Pop Str Covariate Boxplots are plotting the individual structural parameter values (Cl, V, etc.) by covariate category. These usually show similar patterns as the eta plots. However, many recommend to focus more on eta plots as these isolate unexplained variability and that is what you are trying to reduce with addition of covariates to your model.
Review of diagnostic plots is mostly subjective, looking for apparent patterns, trends that suggest areas for model improvements. Just because there's a pattern does not mean that the covariate is "significant" -- That needs to be confirmed by adding the covariate to the model and assessing whether the -2LL drops by the amount corresponding to the significance level you have chosen.