Jump to content


Photo

deconvolution


  • Please log in to reply
35 replies to this topic

#1 Angus McLean

Angus McLean

    Advanced Member

  • Members
  • PipPipPip
  • 223 posts

Posted 14 September 2012 - 02:25 PM

For a modified release drug formulation deconvolution is accomplished within WinNonLin by the deconvolution tool. Another optional way of looking at this is to consider the model whereby an oral dose of drug (D mg) is released into the gastrointestinal tract with release rate R. The drug is then absorbed with absorption rate K01 into the central compartment, the transfer rate into the peripheral compartment is K23; transfer back is K32. The elimination rate from the central compartment is K10.


From plasma concentrations following oral dose of an immediate release formulation I have estimates of K10, K23, K32 and I have the plasma concentrations of MR formulation following oral dose. I want to deconvolute the MR plasma concentrations to obtain the the invivo rate release profile (R values), which are the invivo release rates into the GI tract (not the invivo absorption rate).


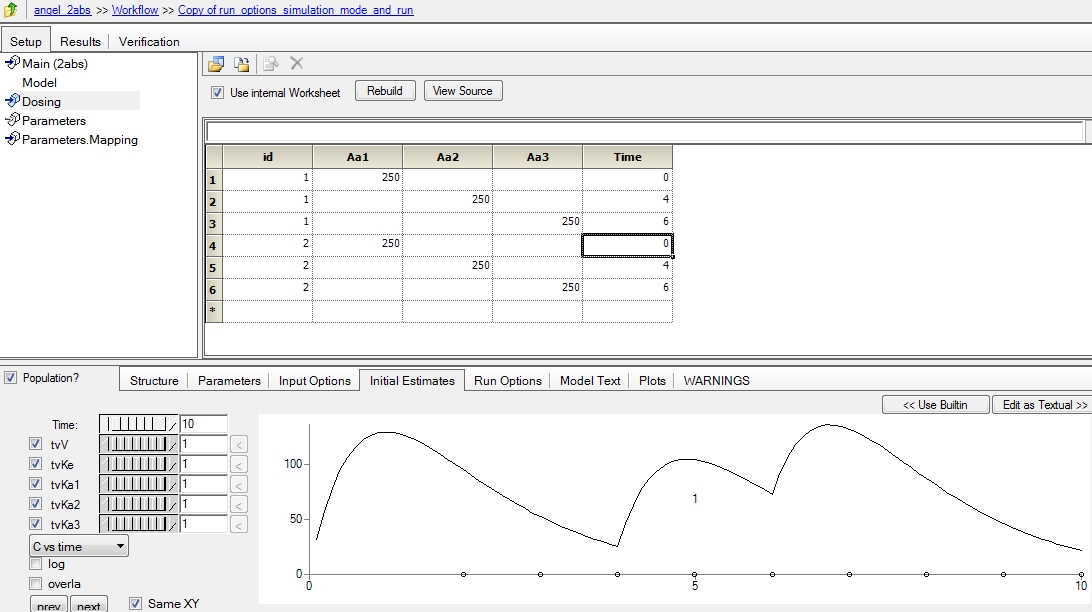
Here is some embryonic code and I am looking for suggestions as to making this code work in WinNonlin or Phoenix. For example how to get the dose included in the model and get F in units of the concentration. So I I have NCON at 3 by that I mean to have the single dose defined and the time (0) and amount of the dose.


NFUNCTIONS 1

NDERIVATIVES 2

NPARAMATERS

NCON 3

PNAMES 'R' 'K10', 'K01', 'K23', 'K32', 'V_F'


START

Z(1) =0

Z (2) =0

Z(3) = 0


END


DIFFERENTIAL


D(Z1)= R - k01 *Z(1)..................................................Gastrointestinal tract


D(Z2) =k01*Z(1)-(k10 + k23)*Z(2).............................Compartment 2 {central}


D (Z3) =k23* Z(2) -k32*Z(3).......................................Compartment 3 {Peripheral}

END

FUNCTION 1


F = Z(2)/V_F


END

EOM


#2 Simon Davis

Simon Davis

    Advanced Member

  • Administrators
  • 1,316 posts

Posted 08 October 2012 - 05:04 PM

Angus,
Sorry I've been on paternity leave and only got back last week so working through my mails and moderation of this forum now. This is a bit of a general answer but should hopefully move you in the right direction.

The best recommendation I can give for learning the new Phoenix modelling language (PML) of WinNonlin is to study the built-in models and, as you make changes with e.g. drop down boxes, study the code changes (full code is always given in the tab; "Model Text"

I would also work through the examples guide, specifically the NLME examples - the use of graphical editor etc. are equally valid even if you aren't running a pop analysis. You can find this in the documents folder of the install, (and in the examples folders you will find the data and code files)

e.g. C:\Program Files (x86)\Pharsight\Phoenix\docs

A major advantage of PML is you don't need to write extra loops to handle multiple doses. Also if you are not sure about the syntax you are editing try clicking apply midway through and you will see various options presented; e.g. below you can see dose point can be qualified by 4 options;

Posted Image

Simon.

Attached Thumbnails

  • dosepoint.jpg


#3 Angus McLean

Angus McLean

    Advanced Member

  • Members
  • PipPipPip
  • 223 posts

Posted 08 October 2012 - 07:15 PM

Simon : Welcome back:


 Thank you for the note. Right now I am focussing on USER MODELS from WinNonlin (5.3). I have some experince with those, I am thinking that these user models (ASCII) will also run in Phoenix. There is information concerning the Syntax of the programming language in WinNonlin in the Example guide. e.g if there is an IF statement there also a companion ENDIF.


Would that be true?


I have not as yet explored the opportunity for user models in Phoenix.


Angus


#4 Simon Davis

Simon Davis

    Advanced Member

  • Administrators
  • 1,316 posts

Posted 08 October 2012 - 07:57 PM

Hi Angus, You're right user models written in the classic language (ASCII) will also run in Phoenix, but there is limited documentation in the Phoenix manuals since this is now considered obsolete and any new bugs found will not be fixed.


specifically yes and IF block is bracketed with those two statements.

 e.g if there is an IF statement there also a companion ENDIF.


  I would really recommend exploring the new PML language as soon as you can. I guess you are trying to model two compartment oral absorption where the dose is released at a specific rate rather than dumped into the gut.


   We would suggest that you could solve this by having a solid drug compartment, dissolved drug compartment (Z1, below) then the PK model. Probably use the differential of a Weibull or some other parameterized release rate to move drug from solid to dissolved.


Note your original code needs to use "DZ(1)", etc.. rather than "D(Z1)"


   Simon.


#5 Angus McLean

Angus McLean

    Advanced Member

  • Members
  • PipPipPip
  • 223 posts

Posted 08 October 2012 - 09:05 PM

Yes; thank you for the correction ...DZ(1) is indeed the identifier for the the differential equation. The devil resides in detail.


Yes having a compartment with the solid drug dissolving to produce a solution is attractive. Yes; the differerential form of the cumulative Weibull is one equation I do have. Most probably I would use the equation, which best fits the dissolution profile fo the drug formulation.


First order absorption is envisaged the 2 compartment kinetics (first order elimination).


I will explore the pml language with examples given and also ones I have in the obsolete language of WiNonlin.


#6 Angus McLean

Angus McLean

    Advanced Member

  • Members
  • PipPipPip
  • 223 posts

Posted 08 October 2012 - 10:05 PM

Yes; in fact furthermore whn I look back to previous work what you suggest is what I did at an ealier date and it worked OK.


Approach:

Step 1 evaluate the dissolution of drug by a model and calculate the cumulative weights of drug dissolved at the dissolution timepoints from the the dissolution model (could be Weibull).


Step 2 the weights of drug dissolved at each of the individual dissolution time intervals were used as inputs to the pharmacokinetic model along with the observed plasma concentrations and timepoints of the blood draws.


It was done as a 2 step procedure and it worked fine. I guess what I am looking for is a way to do perform this work in a one step procedure. My thought is to have a model whereby the steps 1 and 2 are combined into one a one step mode. I may be asking too much?


#7 Angus McLean

Angus McLean

    Advanced Member

  • Members
  • PipPipPip
  • 223 posts

Posted 10 October 2012 - 04:35 PM

Simon: I followed up this morning. Yes; I was able to import my ASCII model from WinNonlin into Phoenix and it ran OK. It is a mutliple dose simulation (10 doses) and each dose has a unique k01, V_F, and K10. It ran OK as a simuLation. I provided the timepoints plus model PK paramaters to mget the model predictions.


PML:


I looked for the PML code that accompanies each of the PK models in the program, but could not idenfiy the tab that show the coide. I am referring to models such as model 3 e.tc. not the NLME models. I


I have asked support here for more detailed instructions to find this TAB


#8 Ana Henry

Ana Henry

    Advanced Member

  • Members
  • PipPipPip
  • 232 posts

Posted 10 October 2012 - 05:36 PM

Hello,
To view your PML code when using Library models look at the Text Model Tab. Screenshot attached.

Hope this helps.

Ana Posted Image

Attached Thumbnails

  • NLMEUI.gif


#9 Angus McLean

Angus McLean

    Advanced Member

  • Members
  • PipPipPip
  • 223 posts

Posted 10 October 2012 - 09:24 PM

Yes; thank. This pertains to an alternative apprpoach. I was thinking that you can see the pml code when you are performing a similulation with the included models in the usual way. but there is I see an alterantive menu to doing this right at the beginning. What I was trying could not be done. It is the saem model used but you cannot see it.


#10 Angus McLean

Angus McLean

    Advanced Member

  • Members
  • PipPipPip
  • 223 posts

Posted 13 October 2012 - 08:15 PM


I already have the model in BOOMER attached to this note as an image file . You can see that it is graphically presented and easy to follow. I think that the PML modeling can be done by assembling graphical objects as e.g. compartments e.t.c. shown in this model. So it would be a useful exercise to work towards doing this (or one a little simpler) in the new language. The one shown would allow simulations (not fitting) to be done with 5 doses (possibly different sites) at different lagtimes and ka values and a common value for Volume.

I will see how a simple existing model work first and try and see if I can replicate one. I think this is the best approach.

if you look at the enclosed image you will see clearly the direction of my thinking.


Angus Posted Image

Attached Thumbnails

  • FIVE_SITES_SIMULATION.jpg


#11 Angus McLean

Angus McLean

    Advanced Member

  • Members
  • PipPipPip
  • 223 posts

Posted 21 October 2012 - 09:29 PM

Above literature modeling examples e.g Boomer are too complicated to assist learning PML (Phoenix modeling language). What i did do was to follow Ana's instructions and open some simple Phoenix models.


1) Make a new project (file>new project)

2) Make a new Phoenix model object (Insert>Phoenix Modeling>Phoenix Model)

3) Select the built in model of your choice. Deselect the "closed form" checkbox if you wish to see the differential equations in the model code in the next step.

4) Click on the model text tab (tab is in bottom half of screen, near the right)


I looked at the model text and also the corresponding graphical presentation of the model. This worked well for me. I understood the differential equations reasonably well. {It seems we have an engineer as the programmer}. Now this program has been designed from the point of view of using graphics to build the models just like an artist painting on a canvas.


With this thought in mind I tried what I thought would be a useful exercise. I fitted a set of plasma concentrations following a single dose and then I simulated what 2 doses would look like (at 0 hr and 4 hr) using the model fitted paramaters. I got that to work and veiwed the predicted plasma concentrations at the observation timepoints.


ARROWS IN THE BACK

Then I tried something more creative; I tried to write a simulation model using the graphics mode. The model was to simulate what 2 doses of the drug would look like, but the second dose (4 hr) would be a second absorption compartment with a different Ka from the first absorption compartment. {The dosing table had a dose entered at 0 and a second one at 4 hours}.


All the other parameters e.g. volume, ke were to be the same. Now I found that graphically I could create a second absoprtion compartment very easily, but could not create a second absoprtion rate constant (ka2) to go with the second absoprtion compartment. I had planned to use the arrow to show the dosing. I am thinking I am doing something cannot be done in Phoenix modeling, but this seems unlikely. It is just that I am not doing it properly. I do not know the rules of this modeling game in Phoenix.


Any comments................


Angus


#12 serge guzy

serge guzy

    Advanced Member

  • Members
  • PipPipPip
  • 485 posts

Posted 22 October 2012 - 05:02 AM

Dear Angel In order to create a second Ka with the second compartment, you need to have 2 dose columns. I created a project for you with step by step how to mimic a model similar to you. Look at the data set used to simulate and then all the mdoels I made for you. Let me know if you need more help. BEST REGARDS; SERGE [file name=angel_2abs.phxproj size=1315212]http://pharsight.com/extranet/media/kunena/attachments/legacy/files/angel_2abs.phxproj[/file]

Attached Files


Edited by Simon Davis, 11 December 2018 - 10:14 PM.


#13 serge guzy

serge guzy

    Advanced Member

  • Members
  • PipPipPip
  • 485 posts

Posted 22 October 2012 - 05:03 AM

Dear Angel In order to create a second Ka with the second compartment, you need to have 2 dose columns. I created a project for you with step by step how to mimic a model similar to you. Look at the data set used to simulate and then all the mdoels I made for you. Let me know if you need more help. BEST REGARDS; SERGE [file name=angel_2abs-20121021.phxproj size=1315212]http://pharsight.com/extranet/media/kunena/attachments/legacy/files/angel_2abs-20121021.phxproj[/file]

Attached Files


Edited by Simon Davis, 11 December 2018 - 10:14 PM.


#14 serge guzy

serge guzy

    Advanced Member

  • Members
  • PipPipPip
  • 485 posts

Posted 22 October 2012 - 05:12 AM

Dear Angel

Note that I gave you a populaiton project assuming you have the NLME license. I guess that only minor changes have to be made for the same model uisng only the winnonlin license. he graphical model is indeed the same.

Best

Serge


#15 Angus McLean

Angus McLean

    Advanced Member

  • Members
  • PipPipPip
  • 223 posts

Posted 22 October 2012 - 01:47 PM

Hello: No I do not as yet have the population Pk program. I do know what it is though. I have NONMEM here and I made efforts to learn the program some time ago. With the help of Tom Ludden I did get the program to run on a couple of occasions but did not pursue it. It is a terribly difficult program to learn. Kinetica has a interesting POP PK modeling capability and I have done interesting work with it.

I think it is an exellent field and for sure it will contine to grow in importance in drug development.

Thank you for your example I will certainly pursue it. I plan to repeat the fitting of the single dose data and will atempt a simulation of a first dose (at the first ka) and second dose with a different Ka (from the first dose). I note your instruction of creating another column to accomodate the second ka. I feel that I should then be able to use the graphical approach when introducing a second dosing absoprtion compartment. This entire program has a common platform for modeling to accomodate POP PK as well. It was written to get users over to using graphics when constructing models.

I have to fit in learning this new program at weekends or evenings when I have time.

Angus

#16 Simon Davis

Simon Davis

    Advanced Member

  • Administrators
  • 1,316 posts

Posted 24 October 2012 - 03:26 PM

Angus,
I may have misunderstood your question, when you are in graphical mode; selecting any component will then give you options to change it's name, properties etc, in this case i have highlighted that you cna add a dose point to any compartment, by increasing the number to 1

Simon Posted Image

Attached Thumbnails

  • angus.jpg


#17 Angus McLean

Angus McLean

    Advanced Member

  • Members
  • PipPipPip
  • 223 posts

Posted 24 October 2012 - 03:44 PM

Simon: Thank you for ypur reply.


Basically what I am trying to do is first to model the plama concentrations following a single dose of drug using the most simple model i.e. one compartment first order eliminatipon and first order absorption. That I can very easily; also I can then simulate 2 doses using the fittd parameters (V, ke and ka).


Now what I tried to do was to use the graphic model for above and modify it graphically to include a second absorption compartment (with a different ka) with the same dose but everything else the same from the simulatiion). I think you are showing this in your graphic foir the second dose.


The one thing I do not completely follow is dose point. Only 2 are presented. What if you want to have a third absoprtion compartment (wth ka3) at the same dose then how does one do that. There are only 2 dose points offered?


Angus


#18 Simon Davis

Simon Davis

    Advanced Member

  • Administrators
  • 1,316 posts

Posted 24 October 2012 - 03:51 PM

so you have ONE dose e.g. throw a cup of dosing liquid in the subjects face, and you want to model how that is absorbed through different absorption sites;


Skin

Eyes

Inhaled into Lungs

Nasal Mucosa

Buccal Mucosa

Swallowed?


  if so how should i estimate which fractions of the dose are reaching which absorbtion site?


  Or are different doses being given to different sites; if the latter it's easy just another absorption site and corresponding dose column. Can explain your study design a little more ?


  Simon.


#19 Angus McLean

Angus McLean

    Advanced Member

  • Members
  • PipPipPip
  • 223 posts

Posted 24 October 2012 - 04:01 PM

Perhaps a better vision is provided as follows: if you take a capsule with two bead drug formulation the first bead releases immediately and the second bead releases 4 hours later.


Now one can envisage a situation when the ka vales are the same at 0 and 4 hours in which case the simple model applies when performing a simulation.


Now if the ka values was different (ka2) at 4 hours then one can envisage this with a second absorption compartment (dose time=4 hours) with common V and ke. Simulation is performed using ka1 and ka 2 and the other paramaters the same.


Now if there were 3 beads in the formulation the would be a third dose at say 6 hours so this would be a third absoprtion compartment at dose time 6 hours......................ka 3 etc.


Angus


#20 Simon Davis

Simon Davis

    Advanced Member

  • Administrators
  • 1,316 posts

Posted 24 October 2012 - 04:09 PM

OK then that is simple, add a third Absorption compartment all feeding into that central compartment; and your dose sheet would look something like

time DoseA DoseB DoseC
0 250
4 ______ 250
6 _____________ 250

assuming a capsule containing 750 with the different beads in equal proportions

Simon Posted Image

Attached Thumbnails

  • 3abs_sites.jpg


2 user(s) are reading this topic

0 members, 2 guests, 0 anonymous users