Jump to content


Photo

deconvolution


  • Please log in to reply
35 replies to this topic

#21 Angus McLean

Angus McLean

    Advanced Member

  • Members
  • PipPipPip
  • 223 posts

Posted 24 October 2012 - 04:52 PM

Simon: I have to try and follow what you are doing. I assume you have 3 different ka corresponding to each of the 3 dose. I must say I do not follow the reference in your prior example to "dose points" 0. 1, 2. I did not follow that concept.


I have to try and do this using the dose tables you decribe, but also using the graphics to add the different ka to the different compartments. I am thinking you have to construct the dose tables first with the multiple doses and the then you do the graphics prior to running the model


Angus


#22 Simon Davis

Simon Davis

    Advanced Member

  • Administrators
  • 1,316 posts

Posted 25 October 2012 - 08:14 AM

Angus,
I am only putting 1 dosepoint (the small blue circles next to Aa1 to Aa3) per absorption compartment for clarity;

Posted Image

Note each dose point is it's own object in the graphical model, and we are now moving closer to your original request of 5 absorption compartments (which to write is easy, to actually fit is the tricky problem because of the danger of over-parametisation.

Simon

Attached Thumbnails

  • 3abs_sitesMODEL.jpg


#23 Angus McLean

Angus McLean

    Advanced Member

  • Members
  • PipPipPip
  • 223 posts

Posted 28 October 2012 - 02:22 PM

Simon: Thank you for above post. I have been out of the office on business. I studied the material last night. From post #1294 and your instructions I was able to draw the model I wanted in the graphics mode i.e. simulating a 2 bead formulation with one bead (x mg) releasing at 0 time and a second bead (x mg) releasing at 4 hours with a different ka ie ka2 for the second bead. Other paramaters (V and ke) were to be the same for both beads.


I could not get the model to run. The problem is not the graphic of the model, but it is in the accompanying set up tables associated with the model. I have looked at your dosing Table (I think it is the dosing Table for a 3 bead formulation (250 mg given at 0, 2 and 4 hours). Total dose =750 mg. I found myself looking for a long time and do not undertand the ID1 and ID2 data structure. Conceptually I do not grasp the ID1 and ID2 data structure. For the 3 bead work you show you have ID1 and ID2 we have 3 doses at the different dose points with the 3 different Ka (ka1, ka2 and ka3).


 What factors dictates when you go from ID1 to ID2 and ID 3 in this dosing table? That is what I do not follow. Why did you need it go to ID2 and when would you need to go to ID3?


That is what I do not follow. We have 3 ka, 3 different doses.


Please can you enlarge upon this?


Angus


#24 Angus McLean

Angus McLean

    Advanced Member

  • Members
  • PipPipPip
  • 223 posts

Posted 28 October 2012 - 09:39 PM

Nacht und Nebel:


Furthermore I continued. I have already modeled one set of plasma concentrations following a single dose and obtained the model fitted parameters in terms of ka, ke and Volume from WinNonlin. I have imported the time points from this set into Phoenix, but not the corresponding concentrations. The fitted values were to be used for the Phoenix simulation.

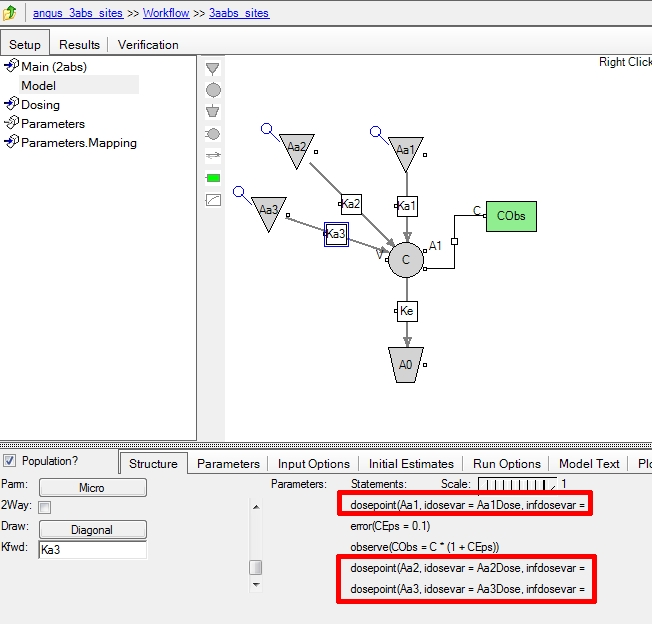
I selected the model option first order elimination, first order absorption, Volume in Phoenix.

Also the simulation checkbox was set as was the original plasma concentrations box.

I then followed your instructions and drew the graphical model with A1, A2 and ka and ka2. I think this went OK. I introduced a second ka (ka2) for a second absorption compartment. (Dose time 4 hours after the first).

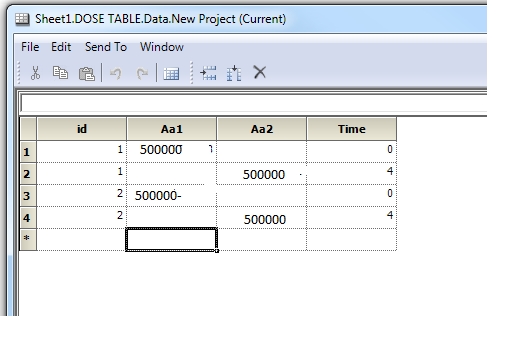
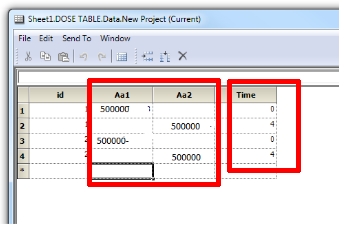
I tried to construct a dosing table analogous to your 3 dose table , but I found that the manually entered parameters bounced out again! So I made an Excel file and imported it into Phoenix (see below). It went in OK .

id Aa1 Aa2 Time

1 x 0

1 x 4

2 x 0

2 x 4


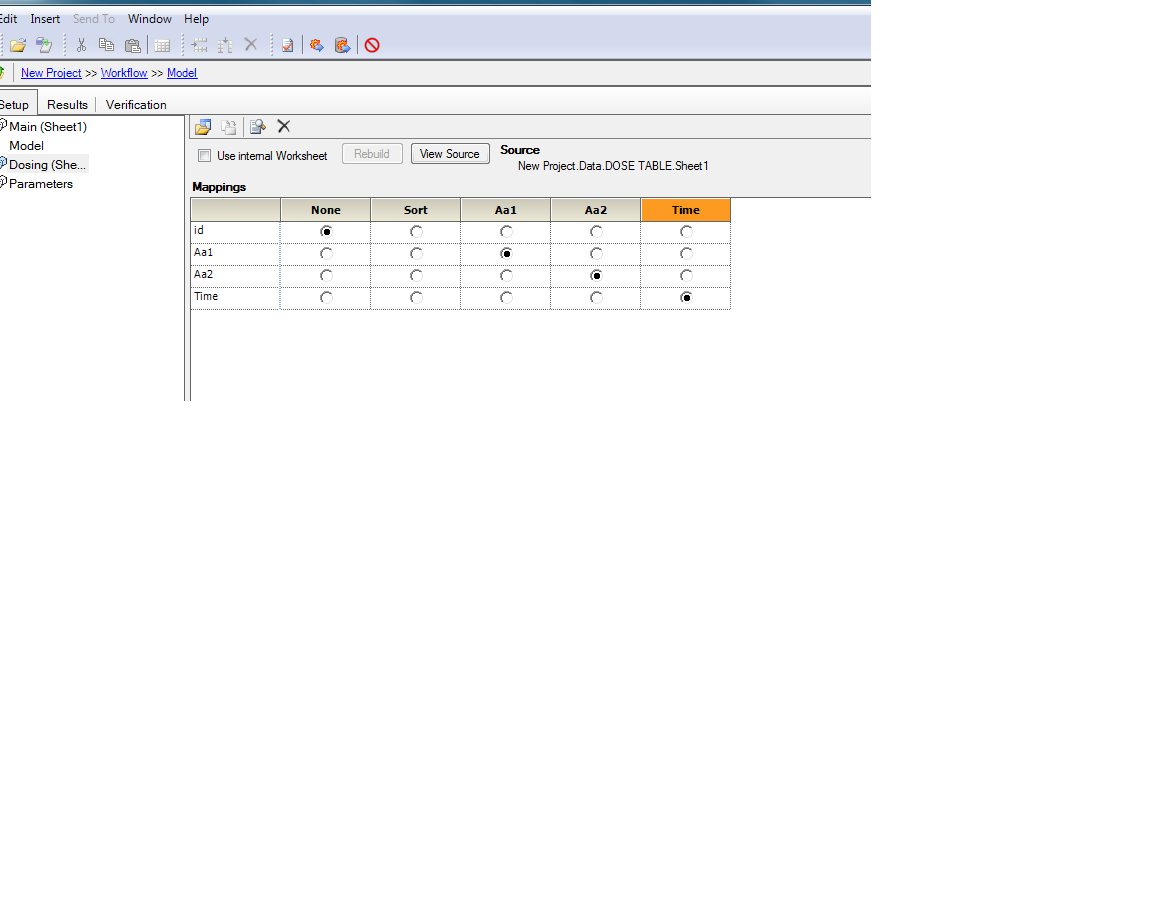
I set the units for the doses and the times. I entered the PK parameters for the simulation and added an arbitrary value for ka2.

I tried to run the model: it ran, but there was no data in the output. I have spent several hours trying to find out what is wrong. I think it is to do with the set up of the tables. Something is not appropriate for the graphical model.

You see I do not know exactly what you are doing to get your 3 dose model to work.


Any thoughts on what a WinNonlin neophyte would do wrong?


#25 Angus McLean

Angus McLean

    Advanced Member

  • Members
  • PipPipPip
  • 223 posts

Posted 28 October 2012 - 09:48 PM

DOSING TABLE HAS NOT COME OUT WELL IN THE LAST MESSAGE: BELOW IS BETTER


id Aa1 Aa2 Time

1 x 0

1 x 4

2 x 0

2 x 4


#26 Angus McLean

Angus McLean

    Advanced Member

  • Members
  • PipPipPip
  • 223 posts

Posted 28 October 2012 - 10:11 PM

DOSING TABLE


let me try this Table from Word 200t:


id Aa1 Aa2 Time

1 X 0

1 X 4

2 X 0

2 X 4


#27 Angus McLean

Angus McLean

    Advanced Member

  • Members
  • PipPipPip
  • 223 posts

Posted 28 October 2012 - 11:30 PM

let me send a file not image file [file name=two_doses_graphic_model.jpg size=745581]http://pharsight.com/extranet/media/kunena/attachments/legacy/files/two_doses_graphic_model.jpg[/file]

Attached Thumbnails

  • two_doses_graphic_model.jpg


#28 Angus McLean

Angus McLean

    Advanced Member

  • Members
  • PipPipPip
  • 223 posts

Posted 28 October 2012 - 11:33 PM

yes; you must attach a file so here is the dose mapping I used for the the 2 doses: there may be a problem here. The results i get are not enoiuhg data. [file name=dose_mapping-20121028-2.png size=43858]http://pharsight.com/extranet/media/kunena/attachments/legacy/files/dose_mapping-20121028-2.png[/file]

And Here is the dose table I used for tnhe two doses so may be problem here. Posted Image

Attached Thumbnails

  • dose_table_used.jpg
  • dose_mapping-20121028-2.png


#29 serge guzy

serge guzy

    Advanced Member

  • Members
  • PipPipPip
  • 485 posts

Posted 29 October 2012 - 12:32 AM

I think you must add the sort by ID as yout table has ID in it.

Best

Serge


#30 Angus McLean

Angus McLean

    Advanced Member

  • Members
  • PipPipPip
  • 223 posts

Posted 29 October 2012 - 12:51 AM

Serge: I tried puttoing the ID in, but I got an error message indicating incompatibilyt with the main Table.


Angus


#31 serge guzy

serge guzy

    Advanced Member

  • Members
  • PipPipPip
  • 485 posts

Posted 29 October 2012 - 01:08 AM

Dear Angel

Is there a way you can send the project. That would allow debugging more easily. You can just attach it.

thanks

Serge


#32 serge guzy

serge guzy

    Advanced Member

  • Members
  • PipPipPip
  • 485 posts

Posted 29 October 2012 - 01:48 AM

Dear Angel I made a winnonlin project that mimics what you are trying to do. I did not get any error and got both simulation as well as a table. Both worked. let me know if you understand what is there and may be we will find what was your problem. best Regards; Serge [file name=angel_2abs_winnonlin.phxproj size=359958]http://pharsight.com/extranet/media/kunena/attachments/legacy/files/angel_2abs_winnonlin.phxproj[/file]

Attached Files


Edited by Simon Davis, 11 December 2018 - 10:15 PM.


#33 Simon Davis

Simon Davis

    Advanced Member

  • Administrators
  • 1,316 posts

Posted 29 October 2012 - 09:54 AM

Morning Angus,
Couple of comments to add to Serge's responses.

In post #1298 the ID1 and ID2 in the dosing table was confusing you, apologies this just shows the same 3 doses being repeated for two subjects as the data file I had open at the time had two subjects in it.

Secondly i think the reason your dose input did not work because on the screen shot it looks like the dose values are being read as text, the clue being they are not right aligned (see the time column is 'correct' for numeric data).
Posted Image

Lastly I wonder if when you were entering dosing info directly to the Phoenix model object you checked the box "use internal worksheet", checking this tells Phoenix that you want to enter data here directly, unchecked it will require a worksheet to be mapped in if the dose is not otherwise mapped on the "Main" input sheet. (again on #1298) I have done the former.

Simon.

PS a couple of forum tips; if you choose the first attachment option you will attach an image file "inline" as I have done above; if it fails to attach then most likely the dimensions are too large and you will have to crop or lower quality in an image editor; I use the excellent (IMO) IrfanView for this.

Also if you ever have problems posting an attachment then just email me directly and I'll append it to your existing post to keep the threads a bit more concise; if I have some time later today I will try and compress some of your dosing posts that I think I are duplicates.

Attached Thumbnails

  • ANgusDOSE.jpg


#34 Angus McLean

Angus McLean

    Advanced Member

  • Members
  • PipPipPip
  • 223 posts

Posted 29 October 2012 - 12:08 PM

Serge: Thanks I just looked at your file. I looked at the mapping.


 Since I am doing a simulation and I have the model fitted paramaters I see no reason to include the concentrations. The only paramaters needed to be included are (a) observation times (B) model fitted PK paramaters i.e Ke, ka and volume plus the doses and the time of dosing.


Before using Phoenix I fitted my model in WinNonlin: I entered a set of time points and corresponding plasma concentrations and peformed a fitting to the 1 cp model (V, Ka and Ke).


I used these same paramaters in Phoenix with the times of the observations and the doses.


I see yoiu rmodel and I think you have included concentrations. I do not think I need them?


Angus


#35 Angus McLean

Angus McLean

    Advanced Member

  • Members
  • PipPipPip
  • 223 posts

Posted 29 October 2012 - 12:17 PM

Thanks Simon: Irfran view is the image program I have: My monitor is large so the image will have to be reduced in size.


Given you remark about the number of subject then that is certainly a factor. I cannot mail you this precise project file. I will change the Table you remarked on. I was thinking that you needed a matrix there.


I will try once again and then see if I can send you an analogous file.


Angus


#36 Angus McLean

Angus McLean

    Advanced Member

  • Members
  • PipPipPip
  • 223 posts

Posted 31 October 2012 - 09:02 PM

With much help from Simon I am progressing with learning how to model Phoenix models.


So far what I have found out is the dance steps to model in Phoenix are as follows:


(a) Create the plasma concentration time points or just the time points {for a simulation} in an Excel file.


(B) Create the dosing Table needed {with ID, doses (Aa) and times of doses}.


© Import both tables into Data in Phoenix. Make sure the units are correct in these Tables.


(d) Import the Phoenix model and select the model needed. Modify it graphically if you wish.


 (e) If performing a fitting of a model to plasma concentrations select "simple". On the other hand if performing a simulation select "simulation" option. Make sure that you fill in the x range needed and the number of simulations and select column C otherwise the simulations will fail.


(f) By linking the data already imported in Phoenix to the model inputs i.e, time points [simulation] or plasma concentration time points [fitting] and doses plus the parmaters in the case of a simulation the model is ready to run. The "paramaters" e.g. Volume, Ka and ke can be entered manually in the case of a simulation. More than one Ka can be used eg. ka1 and Ka2.


Angus


1 user(s) are reading this topic

0 members, 1 guests, 0 anonymous users