Jump to content


Photo

anyone managed to get time-to-event model working?


  • Please log in to reply
31 replies to this topic

#21 Lance Wollenberg

Lance Wollenberg

    Advanced Member

  • Members
  • PipPipPip
  • 36 posts

Posted 04 November 2016 - 02:13 PM

Dear Frank, I am using exactly the same build as yours. Note that I work in Pharsight Consulting Group and we use the same builds that everyone uses. Not sure what is your problem I will contact Linda offline to know more. The current build are not designed to allow simulations ( simulation or predictive check ) with time to event / censoring / categorical endpoints. On the other hand I tried to show you how you can get these models to fit in NLME. Thank you for your feedback this will help us improve NLME. Regards, Samer

Hi Samer,


Sorry to revive and old forum discussion, but does PHX have the capability to simulate categorical events for predictive check in newer builds of PHX? 


#22 Ana Henry

Ana Henry

    Advanced Member

  • Members
  • PipPipPip
  • 232 posts

Posted 08 November 2016 - 04:13 PM

Hello Lance,

I am confirming that the latest version of Phoenix, version 7.0 has categorical event for VPC.


Here is the release note for Phoenix 7.


VPC handles ordered categorical observations (QC 15141): If VPC is requested for a model that contains a multi or ordinal statement, and there are multiple categories, additional VPC plots are generated, one for the probability associated with each category. For example, if the observation is called CAT, having values 0, 1, and 2, then there are plots generated for CAT_0, CAT_1, and CAT_2. These show the predicted and actual probabilities for categories 0, 1, and 2.
Note that for ordered categorical observations, the plot labelled SimQCI, which shows secondary intervals on the predicted quantiles, does not show such intervals, because they are not applicable. It is not possible to suppress the plot entirely because there can be additional Gaussian observations also in the VPC. However, if no secondary intervals are requested, the SimQCI plot is suppressed entirely.


#23 smouksassi1

smouksassi1

    Advanced Member

  • Members
  • PipPipPip
  • 231 posts
  • LocationMontreal

Posted 09 November 2016 - 02:20 PM

Note that Categorical Data say you have an endpoint that is 0/1/2/ is not the same as time to event.

We can do a kind of VPC i.e simulating time to event depending on whatever model/hazard function you have but we have to write it in LL with the simulate argument telling the software exactly how to simulate.


the short answer is that VPC is not yet automatic for time to event you need to write code.


Bests,

Samer


#24 mittyright

mittyright

    Advanced Member

  • Members
  • PipPipPip
  • 98 posts

Posted 09 November 2016 - 03:40 PM

Hi Samer,


I just want to add that because it is difficult to interpret the VPC of TTE I need to use Kaplan–Meier estimates of the Cox–Snell residuals and its confidence interval.

There is no chance to see survival plots in PHX at all. That's a pity.


BR,

Mittyright


#25 smouksassi1

smouksassi1

    Advanced Member

  • Members
  • PipPipPip
  • 231 posts
  • LocationMontreal

Posted 09 November 2016 - 04:01 PM

Hi Samer,


I just want to add that because it is difficult to interpret the VPC of TTE I need to use Kaplan–Meier estimates of the Cox–Snell residuals and its confidence interval.

There is no chance to see survival plots in PHX at all. That's a pity.


BR,

Mittyright


Dear Mittyright,

We can do the KM plots in R viar Phoenix Connect.
What we need from PML is the simulation file that we can then post process in R.


A general framework to do this is that on you observed data you do the KM estimaotor stratified or not by a covariate outputting the CI ( very easy in R).


Then we repeat the above process for each replicate then we will have say smooth K-M on simulated data from this we can then compute "median" and percentiles that we want to compare to what we computed on the initial observed data.


Bests,

Samer


#26 mittyright

mittyright

    Advanced Member

  • Members
  • PipPipPip
  • 98 posts

Posted 09 November 2016 - 05:10 PM

Dear Samer,


thank you for reply.

You are right, we need R for plotting this.

BTW I need to import the simulated table to the PHX first, because there is no way to use it directly in PHX environment. It is funny that I can do the right click on it and send it to the other PHX object, but cannot see it in the new object created. I think that's because it is stil in to-do list:-)

As a workaround I'm using 'copy result files to directory' in Run Options and then import the simtable in R through connect directly. Are you using more convenient workaround?


I suspect huge performance troubles in simulation tables manipulation if PHX continues to use csv format for simulation tables (you know they could be VERY big).


And the second question regarding VPC handles ordered categorical observations 

Do you have an example how should it work? I cannot get different plots for different categories


All the best,

Mittyright


#27 Lance Wollenberg

Lance Wollenberg

    Advanced Member

  • Members
  • PipPipPip
  • 36 posts

Posted 09 November 2016 - 07:51 PM

Note that Categorical Data say you have an endpoint that is 0/1/2/ is not the same as time to event.

We can do a kind of VPC i.e simulating time to event depending on whatever model/hazard function you have but we have to write it in LL with the simulate argument telling the software exactly how to simulate.


the short answer is that VPC is not yet automatic for time to event you need to write code.


Bests,

Samer

HI Samer,


Thanks for the reply. I meant time to event. Is there code available to help guide simulation of VPC of time to event models available?


Lance


#28 smouksassi1

smouksassi1

    Advanced Member

  • Members
  • PipPipPip
  • 231 posts
  • LocationMontreal

Posted 14 November 2016 - 07:57 PM

We filed a ticket to have an example handy meanwhile if you have a project that you have a time to event model in and that you are happy with, send it to us so we prepare the VPC example with it. Ideally use simulated dummy data that can be freely shareable.

Samer


#29 smouksassi1

smouksassi1

    Advanced Member

  • Members
  • PipPipPip
  • 231 posts
  • LocationMontreal

Posted 14 November 2016 - 07:57 PM

Hi Mittyright,

I have several examples on how to process the data in R and produce plots would that work for you ?

Samer


Dear Samer,


thank you for reply.

You are right, we need R for plotting this.

BTW I need to import the simulated table to the PHX first, because there is no way to use it directly in PHX environment. It is funny that I can do the right click on it and send it to the other PHX object, but cannot see it in the new object created. I think that's because it is stil in to-do list:-)

As a workaround I'm using 'copy result files to directory' in Run Options and then import the simtable in R through connect directly. Are you using more convenient workaround?


I suspect huge performance troubles in simulation tables manipulation if PHX continues to use csv format for simulation tables (you know they could be VERY big).


And the second question regarding VPC handles ordered categorical observations 

Do you have an example how should it work? I cannot get different plots for different categories


All the best,

Mittyright


#30 mittyright

mittyright

    Advanced Member

  • Members
  • PipPipPip
  • 98 posts

Posted 15 November 2016 - 12:49 PM

Hi Samer,


Actually I was talking about PHX, but if you can share some examples in R I'll appreciate that.


Thanks

Mittyright


#31 smouksassi1

smouksassi1

    Advanced Member

  • Members
  • PipPipPip
  • 231 posts
  • LocationMontreal

Posted 15 November 2016 - 02:25 PM

Hi Samer,


Actually I was talking about PHX, but if you can share some examples in R I'll appreciate that.


Thanks

Mittyright

Hi Mittyright,

Let us take this discussion offline and report back to this forums post once we have a good working solution.

Users can always export the outputs and freely process the data in R.

BR,

Samer


#32 smouksassi1

smouksassi1

    Advanced Member

  • Members
  • PipPipPip
  • 231 posts
  • LocationMontreal

Posted 02 June 2017 - 07:16 PM

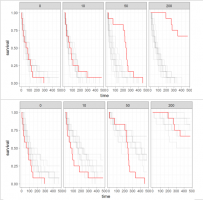
Dear Colleagues, I have put an example VPC with time to event data project on my box link BELOW the forum won't allow me to upload large files like this one. Comments and questions welcome , I use R to process and present the VPC https://app.box.com/...1nx830gr7215g88

Attached Thumbnails

  • ttevpc.png

Edited by smouksassi1, 02 June 2017 - 07:17 PM.

  • mittyright likes this


0 user(s) are reading this topic

0 members, 0 guests, 0 anonymous users