Jump to content


Photo

Sorting Sim/Pred Outputs


  • Please log in to reply
4 replies to this topic

#1 Kirk Bertelsen

Kirk Bertelsen

    Newbie

  • Members
  • Pip
  • 9 posts

Posted 19 August 2014 - 03:44 PM

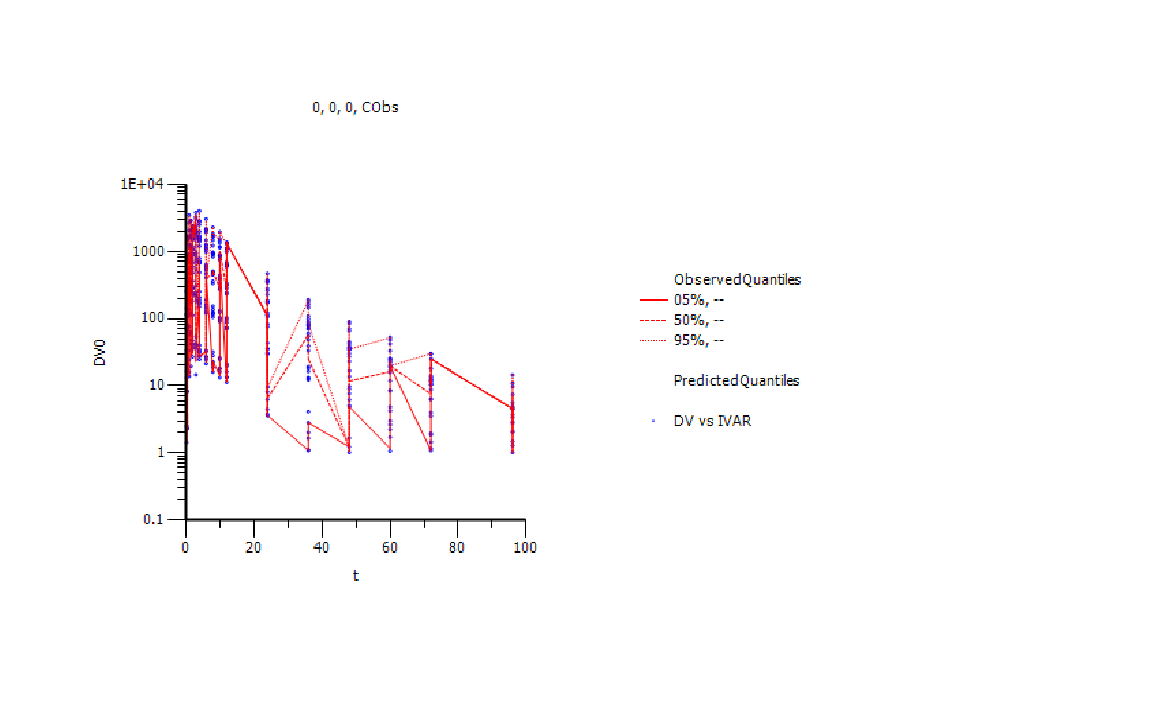
I am trying to generate Sim/Pred outputs from a simple PK model in which I fit for a study in which 5 doses (i.e. 5 single dose cohorts) were used. I cannot seemingly find a way to segregate the sim/pred outputs by dose. Do I list dose as categorical coviarate and then stratify within the Pred Check Options? Any input would be great.

Many thanks

Kirk Bertelsen


#2 Nathan Teuscher

Nathan Teuscher

    Advanced Member

  • Members
  • PipPipPip
  • 46 posts

Posted 19 August 2014 - 04:57 PM

Kirk,

If you are using a Phoenix model, you can add a table with the dosing information. Select the "Table" tab under Predictive Check Options. Specify the time range of the simulation output. Then add the variables of interest to the Variables option, including the Dose (A1 or whatever it might be named in your model). Here's a picture of the Table option in the Phoenix Model:

[img size=400]http://i.imgur.com/MILSc8R.png[/img]

Good luck,
Nathan

SAAD: Edited to make the image part of the Forum DB rather than an external file incase these are lost upon migration Posted Image

Attached Thumbnails

  • predCheckTBL.png


#3 Kirk Bertelsen

Kirk Bertelsen

    Newbie

  • Members
  • Pip
  • 9 posts

Posted 19 August 2014 - 06:34 PM

Hi Nathan,

Thanks for the response, but I am trying to segregate my a OB-PRED plot, not create a tabe. See attached, but what i have right now is an overlay of all 5 cohorts, where I want to segregate a plot for each cohort. Make sense?

Many thanks

Kirk Bertelsen

 [file name=1.png size=28870]http://www.pharsight.com/extranet/media/kunena/attachments/legacy/files/1.png[/file]

Attached Thumbnails

  • 1.png


#4 Nathan Teuscher

Nathan Teuscher

    Advanced Member

  • Members
  • PipPipPip
  • 46 posts

Posted 19 August 2014 - 06:50 PM

I have 2 ideas ... one that might work, and one that will work:

1. Might work ... Use Dose as a sort in your model. You will have to have a column with the assigned dose cohort in each row. This may require a data wizard step prior to the simulation model.

2. Will work ... Re-create the desired graph yourself. All of the plots are created from output tables in the model. Simply send those tables to an xy plot object and create the sorts needed to create the figure you desire.


Nathan


#5 Kirk Bertelsen

Kirk Bertelsen

    Newbie

  • Members
  • Pip
  • 9 posts

Posted 19 August 2014 - 07:00 PM

Thanks for trying, upon sorting "dose" column, verification tab gives an error message that run mode is incompatible with sort column mapping.


0 user(s) are reading this topic

0 members, 0 guests, 0 anonymous users