Jump to content


Photo

NCA > Setup > Slope selector (Bug?)

Slope selector Time range Start time End time Predicted Elimination phase NCA best fit

  • Please log in to reply
7 replies to this topic

#1 lthornton

lthornton

    Newbie

  • Members
  • Pip
  • 2 posts

Posted 30 June 2016 - 10:37 AM

Hello all


I have encountered a potential bug and would like to know if anyone has experienced the same?


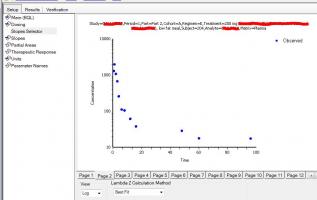
During analysis, when I go to NCA > Setup > Slope selector to review the predicted elimination phase that Phoenix has calculated, the line of best fit is not visible on screen and neither are the Rsq values or T1/2 values.


However everything has been calculated and appear correctly in the final parameters... they just don't appear in the slope selector window. 


This is annoying as I want to review start and end times and can only do so by switching back and fourth from the slope selector to Results > Plots > Observed Y and Predicted Y vs X.


Has anyone else encountered this?

Is there a setting I have accidentally fiddled with or is this likely to be a problem with software/hardware?

Attached Thumbnails

  • Capture.JPG


#2 Simon Davis

Simon Davis

    Advanced Member

  • Administrators
  • 1,331 posts

Posted 30 June 2016 - 10:41 AM

Hi Lee, you should find that once executed using either best fit, or user selection of Lambda_z then once you return to the setup these lines, Rsq, T1/2 values etc. are displayed.


If you still find you have a problem please save a project exhibiting the issue and either post it here or email support and I'll look into it.  Don't forget to confirm which version of the software you are using when reporting a potential bug.


 Simon


#3 lthornton

lthornton

    Newbie

  • Members
  • Pip
  • 2 posts

Posted 01 July 2016 - 11:40 AM

Hi Simon


Many thanks for your rapid reply and apologies for my delayed response.


In trying to put together a non-sensitive example for you I believe I have stumbled upon the answer. 


It seems that this is related to the "one or more graphs have a mismatched lattice page condition" error that can sometimes occur and relates to carry along columns.


I followed the work-around outlined in the Pharsight® Phoenix® 1. 4, Phoenix® WinNonlin™ 6.4 Release Notes and this has fixed the problem, (extract attached).


Thanks again

Lee


Attached Thumbnails

  • Capture.JPG


#4 Meenu

Meenu

    Member

  • Members
  • PipPip
  • 14 posts

Posted 30 December 2016 - 10:32 AM

Attached File  BE.phxproj   137.31KB   511 downloads


Hello, 


I am unable to execute this BE data that I have. The start and end points in the slope selector for lambda_z calculation aren't even showing up (as green lines) Please try to execute this NCA and tell me what went wrong? Using Winonlin 7.


#5 Helmut Schütz

Helmut Schütz

    Advanced Member

  • Val_Members
  • PipPipPip
  • 321 posts
  • LocationVienna, Austria

Posted 30 December 2016 - 11:30 AM

Hi Meenu,


I am unable to execute this BE data that I have. The start and end points in the slope selector for lambda_z calculation aren't even showing up (as green lines) Please try to execute this NCA and tell me what went wrong? Using Winonlin 7.


I had no problems in getting best fits when re-executing your project (PHX 7.0.0.2535 64 bit on Win7 Pro). However, the automatic algorithm does not give reasonable fits (e.g., #3 Capsule, #5 Tablet, #9 Tablet) Attached my suggestion.

Attached Files


 Best regards,
Helmut
https://forum.bebac.at/

#6 Meenu

Meenu

    Member

  • Members
  • PipPip
  • 14 posts

Posted 30 December 2016 - 11:36 AM

Hi Meenu,


I had no problems in getting best fits when re-executing your project (PHX 7.0.0.2535 64 bit on Win7 Pro). However, the automatic algorithm does not give reasonable fits (e.g., #3 Capsule, #5 Tablet, #9 Tablet) Attached my suggestion.


Thank you so much for your kind reply! I'm using it on Windows 10. It is actually a BE data and I also wanted to add partial areas to it. 4 to be precise. I wanted to compute AUC0-4, AUC4-8 AUC 8-12 and AUC- 12-24. When I add these, it doesn't execute and says there's an error!

Also, do the green lines for lambda_z come only after executing? 


#7 Helmut Schütz

Helmut Schütz

    Advanced Member

  • Val_Members
  • PipPipPip
  • 321 posts
  • LocationVienna, Austria

Posted 30 December 2016 - 02:50 PM

Hi Meenu,


[…] I also wanted to add partial areas to it. 4 to be precise. I wanted to compute AUC0-4, AUC4-8 AUC 8-12 and AUC- 12-24. When I add these, it doesn't execute and says there's an error!


Worked perfectly in the project I uploaded.


Also, do the green lines for lambda_z come only after executing?


You should see them only after the best fit algo was executed.


 Best regards,
Helmut
https://forum.bebac.at/

#8 Meenu

Meenu

    Member

  • Members
  • PipPip
  • 14 posts

Posted 31 December 2016 - 06:30 AM

Hi Meenu,


Worked perfectly in the project I uploaded.


You should see them only after the best fit algo was executed.

Thank you so much sir!!! Very kind of you! I might have made an error somewhere!


Also tagged with one or more of these keywords: Slope selector, Time range, Start time, End time, Predicted, Elimination phase, NCA, best fit

0 user(s) are reading this topic

0 members, 0 guests, 0 anonymous users