Jump to content


Most Liked Content


#1833 calculating inter-individual variability

Posted by Lance Wollenberg on 23 July 2013 - 10:31 PM

Hi,


My colleagues and I were having a discussion on calculations regarding the omega and omegastderr output and getting this into useful terms that can help you better understand the variability for the purposes of reporting. We are hoping experts in the extranet community could help to clarify.


I know that the output on the omega block generates a variance.


For proportional/exponential error models

CV=sqrt(omega)*100


For additive error models

SD=sqrt(omega)


Are these conventions correct dependent the error model structure you select?


For the omegastderr, how does this term relate to the final parameter estimate? What math is involved to get this into an %RSE term?


To our understanding, for a given parameter

%RSE=(Omegastderr)/SQRT(Omega)*100


Is this correct? From what I can tell this is different than the calculation that is done with NONMEM output. Any insight would be greatly appreciated.


Lance


  • Micaela Reddy, Albertsnarm, Natalinak and 68 others like this


#7133 Closed form vs differential equation

Posted by cmukashyaka on 30 November 2023 - 04:30 PM

Hello,

I am running a 2-compartment linear model, when I don't click closed form to use differential equations, the model is not converging with error message:


Initial parameter values result in -LL = NaN

 Restart from new values
Error: Model Exception: Fortran Exception
NlmeErrorExit: close files and exit(0).
 
Additionally, initial estimates graphs have some subjects with negative concentrations. I change initial estimates to no avail. 
 
However, when I run the exact same model in closed form, the model runs fine and I get descent fits and parameter estimates with good CV%. 
 
Anyone else experienced this? 

Attached Files


  • WalterNic, ??????????????? ??????, DanielGon and 67 others like this


#7375 How to introduce correlations between random effects?

Posted by CryptoCurrencySmite on 19 March 2024 - 05:50 PM

Can we explore the impact of introducing correlations between random effects in PK/PD modeling on the accuracy of predictions and the understanding of complex drug disposition mechanisms?


  • Paulawrilm, Natalinak, CryptoCurrencySmite and 65 others like this


#7194 Log-transformed plasma concentration-time profiles

Posted by Davidq8 on 06 February 2024 - 05:54 PM

Hello, I am working on a model, and I need to test the model with plasma concentration to be log-transformed.

Is there an option in the software to transform drug exposure data from normal scale to log scale, or should it be done first before uploading the dataset?

Also, How can I transform estimated PK parameters back to normal scale after the analysis using the software?


  • Natalinak, DonaldCLILE, DanielGon and 63 others like this


#7251 Questions about plots CWRES-IVAR and CWRES-TAD

Posted by zzzZ on 26 February 2024 - 07:31 AM

Dear all,
       Thanks for your reading!I’m a student who is learning population pharmacokinetic modeling using Phoenix NLME. In my Pop CWRES-IVAR plot and Pop CWRES-TAD plot, there is always no blue and red lines regadless of the residual error using additive, multiplcicative, mix ratio and so on. Why? Does this matter? How can I solve it?
       The total sample size was 157 from 38 patients. The blood collection times were mostly at 0, 1.5, 2, 2.5, 3 h, and partly at 0, 1.5h.
       Hope for your answers! Grateful!

  • Ilyianoigh, StevenTuh, DanielGon and 62 others like this


#7108 Synthetic Gradients

Posted by Davidq8 on 08 November 2023 - 02:42 AM

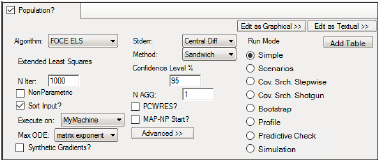
Hello, I have a question regarding the option to use synthetic gradients while running a model. 
I found in the instruction manual that activating this option may improve speed and accuracy, however it is not the default configuration when running a model.
My question is whether I should expect a difference in estimated model parameters if I choose this option instead of the default setting.
Thanks 

Run_Options_tab.png


  • Cyharlesbob, Timothydrift, DanielGon and 57 others like this


#7097 Reporting shrinkage for IOV

Posted by cxzhang on 13 October 2023 - 04:42 AM

Dear all,


For a popPK model I am working on, I estimated interoccasion variability (IOV) for CL for 4 different occasions, assuming the IOV estimates to be the same for all 4 occasions due to limited data availability. Therefore, I obtained 4 identical omega estimates and 4 identical standard error estimates for the four occasions (i.e. IOV on CL for occasion 1 =  IOV on CL for occasion 2 = IOV on CL for occasion 3 = IOV on CL for occasion 4). My understanding is that I only need to report one estimate and its standard error for IOV on CL as my model output, instead of reporting the same set of values 4 times defined by the occasions. However, I do not know what to report for the shrinkage associated with IOV on CL. In the Omega sheet, 4 different shrinkage values were shown associated with the 4 occasions, ranging from 0.3 to 0.9. From looking at published studies, people report only one shrinkage value for each IOV tested. How can I obtain an overall shrinkage value to report for the IOV on CL? The number of data points for each occasion are different (e.g. intense sampling on occasion 1 and 4, sparse sampling on occasion 2 and 3), in case this matters.


Thank you for your help!


  • Stevensi, Thomasgaks, Austingar and 57 others like this


#7063 Limits to EObs

Posted by frrd@lundbeck.com on 06 September 2023 - 09:15 AM

I have some activity data from mice in time bins. The observed data is in percent of time they are mooving. If the mice are stimulated many will move around 100% of the time. However, some of the mice that moove 100% of the time are more stimulated than others so we observe a ceiling effect. So the real Emax is higher than the observed Emax which is limited by a ceiling of the measurements. I would like to convert my PD model with a ceiling effect so that. eg (0,0.3,0.9,1.2,1.5) preddicted from the model is converted to (0.30,90,100,100). I tried


logit(Emax*E/EC50+E)


or 


E= ln (EB / (1 - EB))

EB= Emax*E/EC50+E


However both ln and logit does not work in the model structure. Is there another way to do this effect prediction with a ceiling? 


BR Frederik


  • XRumer23Teams, Cyharlesbob, Michaelnof and 57 others like this


#7072 Continuous covariate with zero value

Posted by Davidq8 on 19 September 2023 - 10:02 PM

Hello, I'm working on a model and trying to determine how a continuous covariate would affect the Pk parameters of a drug.
 
This covariate has a value of zero for some subjects and an integer value "above zero" for other subjects.
 
Even though eta plots demonstrate a significant correlation between the value of this covariate and Pk parameters, I don't get any iterations when I conduct stepwise analysis to evaluate the impact of this covariate on the drug parameters.
 
Does that imply that the continuous covariates must always have a value greater than zero ?

  • XRumer23Teams, KennethBoisp, DonaldKiz and 55 others like this


#7046 Covariate effect explanation

Posted by Davidq8 on 03 August 2023 - 10:59 PM

Hello, I have a question about communicating the covariate impact to people who are unfamiliar with the Nonlinear mixed effect methodology used in PopPk analysis.

So, suppose we have body weight influencing drug (X) clearance, and an increase in body weight is associated with a decrease in CL, with the impact estimated by the model (- 0.5).

Can we say that increasing body weight by 10 kg intervals results in a 5% reduction in drug clearance?


Thanks     


  • RandyLof, Michaelnof, DanielGon and 55 others like this


#7394 covariate

Posted by linda on 21 March 2024 - 08:22 PM

Hi all, 

1. What method does Phoenix use to assess significance of covariate relationships with PK parameters in pop PK model?


2. After I add a binary categorical covariate to the model. In the result tab, I can get a boxplot of "eta with cov" and "str with cov". What method did Phoenix to generate those plots and  Can I use those plots to assess the signification of correlation?


Thanks,

Linda


  • Natalinak, Megansturi, RonaldAxon and 54 others like this


#7093 Reminder: Staging will be Upgraded to Integral v23.10.1 Friday 13th October,...

Posted by Simon Davis on 11 October 2023 - 11:45 AM

Lead users at each company should already have received this notification last month and reminder yesterday with Draft Release notes so check you junk folders if you have not seen this please.  If you want to be added to that distribution list then please contact me.

We will give a general session for all existing users to discuss these new features on Thursday at 10 am EST, the session will last no more than an hour and will be recorded.  You may register below.


https://certara.zoom...qQVO7EChtLx2Wnw


With the next release of Integral 23.10.1, Certara will release a new feature for its industry-leading data repository that will support data storage requirements where 21 CFR (Code of Federal Regulations) Part 11 signature compliance is not necessary. The feature will allow specifically licensed Integral users to interact with designated folder structures without needing to securely sign for every interaction.  This feature will be available to both fully licensed users and partners, and the feature will work in the same repository where eSignature can still be required for 21 CFR Part 11 clinical studies.

For our users to preview this,  on Friday, 13th October, we propose to upgrade www.integral-staging.certara.com/
to the 23.10.1 release candidate, please anticipate a short down time from 11a.m EDT when the repository will be unavailable.


User action will be required: 

Complete and save work, and logout before 11 am (EST)

The Phoenix Integral 23.10.1 plug-in (or Integral Client 23.10.1) will be required and we will distribute the download links shortly.
Be sure to use the most recent versions of Phoenix 8.2.2, or 8.3.4, 8.3.5 or 8.4 with 23.10.1, prior versions are not tested or supported with this version of Integral. 


Thanks, Simon DAVIS

Senior Manager, Support


  • DanielGon, FrancisLaple, Zacharysaund and 52 others like this


#6769 Parent drug with metabolites and GI pre-systemic metabolism

Posted by Davidq8 on 23 October 2022 - 12:24 AM

Hi
I am trying to build a PopPk model for a drug with its metabolite (active) as a joint model. I found a published model where they modeled the portion of the metabolite formed from the parent drug in GI (pre-systemic). I tried to build a similar model using the graphical interface option in NLME.
 
For pre-systemic metabolism, I created a deposit compartment using the (Duration) function in the absorption compartment and then two absorption rates, one to the central compartment of the parent drug and another directly to the central compartment of the metabolite. I am unsure if this defined the pre-systemic metabolism step described in the published model.
 
The other issue, I am trying to model the fraction of parent drug clearance attributed to metabolite formation and the fraction to other not active metabolites (not needed to be included in the model). I do not know how to do that using NLME. 
 
Can I get help with this issue?
 
I attached the model file I created and the pharmacokinetic model structure for the published paper. 

Attached Files


  • XRumer23Teams, Cyharlesbob, DanielGon and 50 others like this


#7285 Fraction Drug Dissolved (FRD) and Fraction Drug Absorbed (FRA)

Posted by rezkighassani on 29 February 2024 - 01:35 PM

Greetings,


I would like to ask what is the difference between Fraction Drug Dissolved and Fraction Drug Absorbed? Then how to calculate these 2 parameters.
 
Thank you.

  • Albertsnarm, XRumer23Teams, Cyharlesbob and 48 others like this


#7019 Identify the dose-to-metabolite ratio.

Posted by Davidq8 on 11 July 2023 - 03:18 AM

I'm developing a model in which the parent drug is metabolized to an active metabolite and a portion of the oral dose is metabolized in the GI to the active metabolite. I am trying to model the amount that is metabolized from the dose in addition to remaining amount goes to the central compartment of the parent drug.

I found this model created by one member who tried to build the structural model using graphical model, however, he did not account for fraction of the dose went to the parent and metabolite compartments. 


Can I get help on how to model the fraction formed?


I am attaching the model and a schematic description of a model that shows the structural model details.


Attached Files


  • Albertsnarm, Natalinak, Thomasgaks and 47 others like this


#7145 Using observed baselines values as fixed parameter value

Posted by cmukashyaka on 12 December 2023 - 10:06 PM

Hello,

I am working on an indirect response model (limited inhibition of Kin), I have baseline values for each subject measured at the start of study. I need to use these values and fix them as E0 where E0 = Kin/Kout so that I can only estimate either Kin or Kout but not both at the same time.

I think there is a way to have these baseline values in a separate column in dataset and set them as covariate in the model code text. Can someone please help me with an example PML code that I can use to accomplish this? 

For dataset, do I add these at each timepoint for each individual as I would for other covariates or only at time=0 where they are actually measured?


If my thinking of approaching this is off, how can I take care of this? I don't want to fix E0 to a single value without implementing the interindividual variability observed with baseline measurements. 


Thanks a lot


  • Natalinak, AaronToots, RandyLof and 44 others like this


#7118 Copy Plots as High Resolution Image (vector) - Issues

Posted by danielcoliveira4 on 13 November 2023 - 04:54 PM

Hello,


I am attempting to save relevant modeling plots as vector images. I have tried a couple of things without success


1. Print PDF (does not show up as vector image)

2. Export as JP or PNG (these are not vector files)

3. Copy high resolution image and paste to word document - this does produce a vector image but it is cut off (see file attachment).


Anyone else encounter this issue? Trying to fix this instead of using a third-party licensed program to convert the non-vector output into vector


Attached Files

  • Attached File  snip.PNG   16.11KB   52 downloads

  • RandyLof, WalterNic, Thomasgaks and 42 others like this


#5694 Extended examples provided with the installation

Posted by Simon Davis on 11 June 2019 - 02:30 PM

In a recent training it became evident that some users had not found the folder referenced in;   C:\Program Files (x86)\Certara\Trial Simulator\Docs\Trial Simulator Examples Guide.pdf


If you browse to C:\Users\Public\Documents\Certara\Trial Simulator Projects\Examples  you’ll find over 30 completed projects;


 Simon.

Attached Files

  • Attached File  xmpl.jpg   322.88KB   2 downloads

  • Cyharlesbob, WalterNic, Stevensi and 42 others like this


#7130 Help needed for higher %cv

Posted by Trutino on 29 November 2023 - 09:25 PM

Hi Experts,


Could you please give me some suggestions about my mistake when running modeling?


why is the %CV so high in the Theta sheet? 


Appreciate your help!


Drug administration by IV and dosage is 0.9mg/kg. Cmax=19ug/mL.


  • Austingar, Hubertnop, MalcolmWhany and 36 others like this


#3312 IF(NEWIND.NE.2) equivalent for average concentration calcuation on the fly

Posted by Thomas Klitgaard on 09 March 2016 - 04:04 PM

 Hi there,


Could you illustrate to make the Phoenix equivalent to this NONMEM twist,  to get the the average concentration calculated on the fly, in period btw. current and since last effect response record.


Thx

Thomas


$PK


IF(NEWIND.NE.2)THEN ; set up variables for new subject

LAUC = 0 ; previous AUC

LTM = TIME ; previous time

LAVE = 0 ; average concentration since previous record

ENDIF


KA=THETA(1)

CL=THETA(2)

V=THETA(3)


$DES

DADT(1)=-KA*A(1)

DADT(2)=KA*A(1)-CL/V*A(2)

DADT(3)=A(2)


$ERROR

CP=A(2)/V

AUC=A(3)/V


DTIM = TIME - LTM ; Time difference

DAUC = AUC - LAUC ; Difference in AUC

IF(DTIM.EQ.0)THEN

CAVE = LAVE ; Time has not changed, average concentration is the same

ELSE

CAVE = DAUC/DTIM

ENDIF


; Record current AUC and TIME for next call

LAUC = AUC

LTM = TIME

LAVE = CAVE

BASE = FID1


EFF = EM*CAVE**HILL/(EC**HILL+CAVE**HILL)

IPRE = BASE - EFF

IF(IPRE.LT.0) IPRE=0

Y = IPRE + EPS(1)


  • RobertGok, Cyharlesbob, Williamwrire and 35 others like this