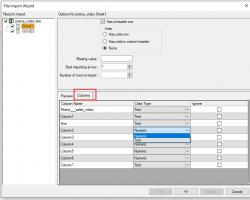
I have a concentration data file where the ID for subjects is given either in numeric or text format eg either 1, 2, 3 etc or R1, R2, R3 etc. Data are in an Excel file. Upon importing the data into WNL, the ID for subjects identified in text format is missing. I have changed the Subject ID column format in Excel to text before import into WNL; this did not solve the issue.
To get around the issue, I then copied over the missing textual subject ID data to the imported concentration file in WNL. The subject ID column was set to text format. This file was then used as source data for the plotting function. The function was set to plot one subject per page. Only graphs for those subjects where subject ID was of the format 1, 2, 3 etc were drawn as individual plots, those subjects with the format R1, R2, R3 etc were all plotted on the same graph. These are final data from a clinical study and the subject ID cannot be changed. Is there a solution to my subject identification problem?


