Jump to content


Photo

NLME model generating different population (PRED) concentration time profile for each subject?

NLME Population PK

  • Please log in to reply
4 replies to this topic

#1 adityark

adityark

    Newbie

  • Members
  • Pip
  • 4 posts

Posted 12 May 2020 - 05:45 AM

I used the Phoenix Model to do a population PK analysis for multiple different subjects and for some reason the population predicted profiles, labeled PRED, are slightly different for each subject. 


I understand the the IPRED values should be different because they are individual concentration predictions for each subject but shouldn't the PRED values be exactly the same for each subject?


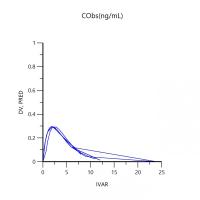
This graph from my oral pop pk model shows the overlaid PRED curves from each individual and the PRED curves are slightly different.

Parent compound oral PRED.jpg


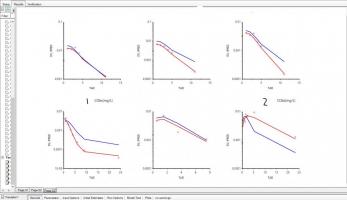
This graph from my oral and IV linked pop pk model shows 6 individual graphs with the OBS value, IPRED curve (red) and PRED curve (blue). If you see the graphs labelled 1 and 2, they are both sampled to 24 h but both have different PRED curves. 

Parent compound oral and IV linked PRED lattice.JPG


Why are the PRED curves not the same for each subject?


Edited by adityark, 12 May 2020 - 06:27 AM.


#2 smouksassi1

smouksassi1

    Advanced Member

  • Val_Members
  • PipPipPip
  • 232 posts
  • LocationMontreal

Posted 12 May 2020 - 06:58 AM

PRED depend on the dose ( which is a covariate that you don't think about)

 do all the subject have the same dose ?

is there any other covariate in your model ?


#3 adityark

adityark

    Newbie

  • Members
  • Pip
  • 4 posts

Posted 12 May 2020 - 07:02 AM

In the first image, all of the concentrations have been dose normalized prior to entering into the data worksheet in Phoenix so the dose is essentially the same for each individual. Also, I have not added any covariates into the model.


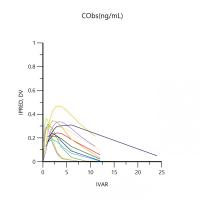
For reference here is the IPRED curves for the same dataset as image 1. While the PRED curves have much less variability than the IPRED curves (as they should), the PRED curves still do have some variability where I believe that they should not have any.

Parent compound oral IPRED.jpg


#4 Simon Davis

Simon Davis

    Advanced Member

  • Administrators
  • 1,331 posts

Posted 12 May 2020 - 08:33 AM

Can you possiby post your project so we can understand better?


#5 adityark

adityark

    Newbie

  • Members
  • Pip
  • 4 posts

Posted 12 May 2020 - 04:38 PM

Can you possiby post your project so we can understand better?


I have attached the project with the oral pop pk model. I have not attached the linked oral and iv model, but I can if that helps.


Attached File  Abbreviated Oral Pop PK Model.phxproj   894.64KB   385 downloads


Also tagged with one or more of these keywords: NLME, Population PK

4 user(s) are reading this topic

0 members, 4 guests, 0 anonymous users