Jump to content


Photo

Covariates with potential interaction

covariate

  • Please log in to reply
8 replies to this topic

#1 joybaker

joybaker

    Advanced Member

  • Val_Members
  • PipPipPip
  • 45 posts

Posted 11 July 2023 - 03:24 AM

Hi,

I see no one ask similar questions. Do you have any suggestions for the PML if I believe there are some interactions for covariates.


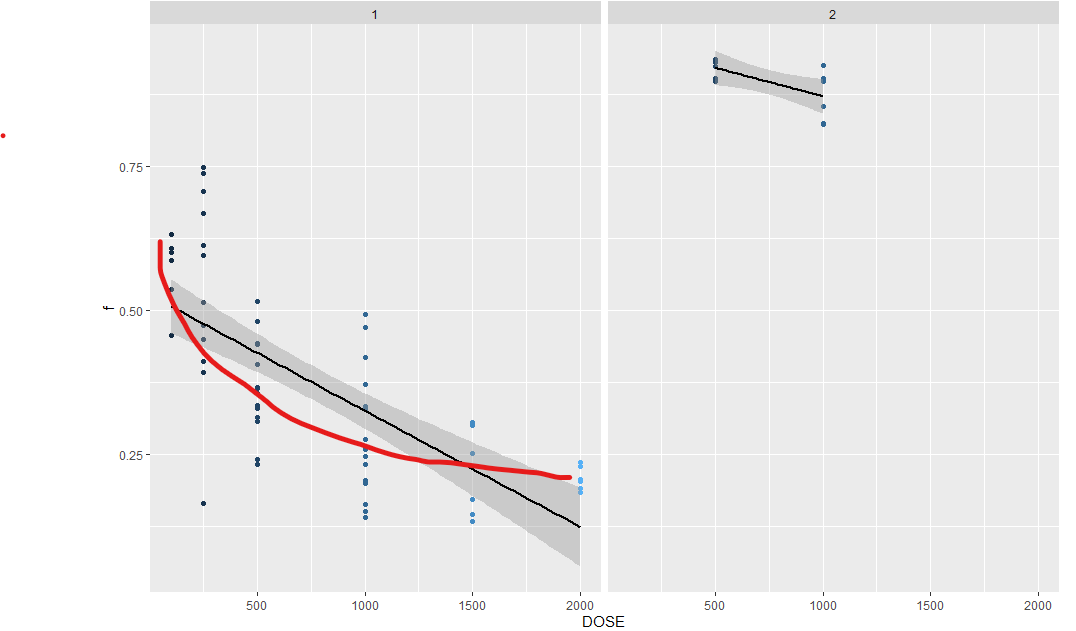
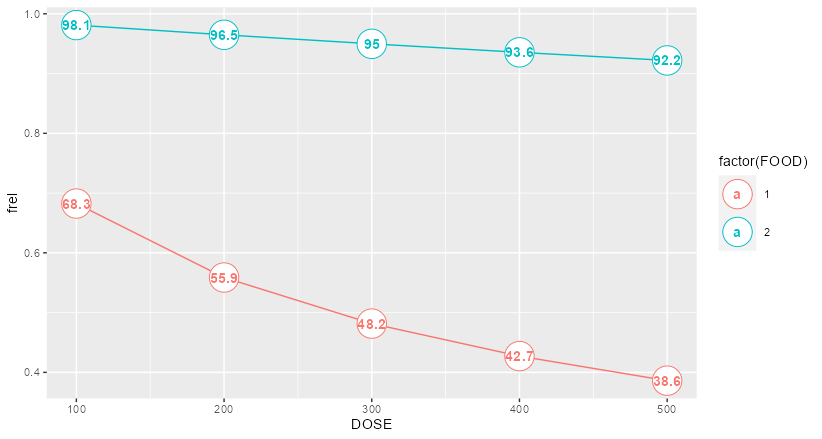
See the graph below that I think dose is correlated with f, while in fasted (1,left) and fed (2, right), the correlation  (or slope  extent) is different.

I have tried to regard them as separate covariates:

stparm(f = ilogit(tvf + DOSE*dfdDOSE+ (FOOD==2)*dfdFOOD2 + nf))


however the prediction is leveraged in lower and upper end of the dose.


Do you have advise for PML to describe this, I use the following but might be good to have more suggestion?

stparm(f = ilogit(tvf + DOSE*dfdDOSE1 + DOSE*dfdDOSE2 * (FOOD==2)*dfdFOOD2 + nf))


  • Thomasgaks likes this

#2 joybaker

joybaker

    Advanced Member

  • Val_Members
  • PipPipPip
  • 45 posts

Posted 11 July 2023 - 03:28 AM

I also tried DOSE/100 and log(DOSE) to sort of standardise it. But I haven't got any results that can give decent prediction for all doses (100 mg underestimate for example)


#3 smouksassi1

smouksassi1

    Advanced Member

  • Members
  • PipPipPip
  • 231 posts
  • LocationMontreal

Posted 11 July 2023 - 06:11 AM

Hi,

this model has no interaction between dose and food effects on f


stparm(f = ilogit(tvf + DOSE*dfdDOSE+ (FOOD==2)*dfdFOOD2 + nf))


the second model should be  written in standard statistics way examples


stparm(f = ilogit(tvf +

                    DOSE*dfdDOSE +

                (FOOD==2)*dfdFOOD2 +

DOSE*(FOOD==2)* dfdDOSEFOOD2

nf))


you can still standardize your continuous covariates or make transfromation of:
 

stparm(f = ilogit(tvf +

                   log(DOSE/100)*dfdDOSE +

                (FOOD==2)*dfdFOOD2 +

                log(DOSE/100)*(FOOD==2)* dfdDOSEFOOD2

nf))


the above is trying to estimate a different food effect depending on dose

not sure what ranges of doses you have and what nonlinearities you are facing


#4 joybaker

joybaker

    Advanced Member

  • Val_Members
  • PipPipPip
  • 45 posts

Posted 11 July 2023 - 02:42 PM

Thanks Smoukassi, your suggestion is very helpful.

Sorry to attach the figure in the question.

The first term you suggested didn't give good prediction for the two ends (100 and 2000 mg), but the log scale gave decent prediction across all doses. 


I wonder this is the because the f-Dose correlation is slight tilted-up (rather than straight linear). What kind of terms I can use if it is even more curved?

Hi,

this model has no interaction between dose and food effects on f


stparm(f = ilogit(tvf + DOSE*dfdDOSE+ (FOOD==2)*dfdFOOD2 + nf))


the second model should be  written in standard statistics way examples


stparm(f = ilogit(tvf +

                    DOSE*dfdDOSE +

                (FOOD==2)*dfdFOOD2 +

DOSE*(FOOD==2)* dfdDOSEFOOD2

nf))


you can still standardize your continuous covariates or make transfromation of:
 

stparm(f = ilogit(tvf +

                   log(DOSE/100)*dfdDOSE +

                (FOOD==2)*dfdFOOD2 +

                log(DOSE/100)*(FOOD==2)* dfdDOSEFOOD2

nf))


the above is trying to estimate a different food effect depending on dose

not sure what ranges of doses you have and what nonlinearities you are facing


Attached Thumbnails

  • 111.png


#5 smouksassi1

smouksassi1

    Advanced Member

  • Members
  • PipPipPip
  • 231 posts
  • LocationMontreal

Posted 13 July 2023 - 11:37 AM

I see a power model shape can accomodate this curvature


#6 joybaker

joybaker

    Advanced Member

  • Val_Members
  • PipPipPip
  • 45 posts

Posted 17 July 2023 - 02:08 AM

Thank you for the reply.

Another question to ask, if I want to check how that model fit with my observed data in VPC and stratified by DOSE, should I define another DOSE column as categorical parameter so that I can check it in VPC (as it was done as continious factor previously to predict other doses)?

I see a power model shape can accomodate this curvature


#7 joybaker

joybaker

    Advanced Member

  • Val_Members
  • PipPipPip
  • 45 posts

Posted 17 July 2023 - 06:14 AM

Apologies this post has been modified as I can't delete it

Just realize log() means ln()


Edited by joybaker, 17 July 2023 - 08:22 AM.


#8 smouksassi1

smouksassi1

    Advanced Member

  • Members
  • PipPipPip
  • 231 posts
  • LocationMontreal

Posted 17 July 2023 - 11:00 AM

no worries for vpc you can yes have a copy of dose where you use one as continious and the other as categorical


fcovariate(dosecat() great that you calculation are now working yes log is natural log ln bests


#9 smouksassi1

smouksassi1

    Advanced Member

  • Members
  • PipPipPip
  • 231 posts
  • LocationMontreal

Posted 17 July 2023 - 01:57 PM

if you have R you can try the attached code
 
tvf = 0.7653
dfdFOOD2 = 3.1847
dfdDOSE = -0.7636
dfdDOSEFOOD2 = - 0.1564
ilogit <- function(x) {exp(x)/(1+exp(x))} 
 
nf <- 0 
DOSE <- seq(100,500,100)
 
FOOD=1
frel_DOSE_food1 = ilogit(tvf + log(DOSE/100) * dfdDOSE + (FOOD==2)*dfdFOOD2 + 
                     log(DOSE/100)*(FOOD==2)*dfdDOSEFOOD2 + nf)
 
FOOD=2
frel_DOSE_food2 = ilogit(tvf + log(DOSE/100) * dfdDOSE + (FOOD==2)*dfdFOOD2 + 
                      log(DOSE/100)*(FOOD==2)*dfdDOSEFOOD2 + nf)
 
data.frame(DOSE= c(DOSE,DOSE),
           frel=c(frel_DOSE_food1,frel_DOSE_food2 ),
           FOOD =c(rep(1,5),rep(2,5))
) %>% 
  ggplot(data=.,aes(DOSE,frel,color=factor(FOOD)))+
  geom_line(aes(group=FOOD))+
  geom_point(shape=21,fill="white",size=10)+
  geom_text(aes(DOSE,frel,label=round(100*frel,1)),fontface ="bold")
FOOD=2
DOSE <- seq(100,500,100)
frel_DOSE_food2 = ilogit(tvf + log(DOSE/100) * dfdDOSE + (FOOD==2)*dfdFOOD2 + 
                      log(DOSE/100)*(FOOD==2)*dfdDOSEFOOD2 + nf)

Attached Thumbnails

  • frelvalues.png


Also tagged with one or more of these keywords: covariate

0 user(s) are reading this topic

0 members, 0 guests, 0 anonymous users